
Articles
- Page Path
- HOME > Epidemiol Health > Volume 45; 2023 > Article
-
Systematic Review
Dietary intake and cancer incidence in Korean adults: a systematic review and meta-analysis of observational studies -
Ji Hyun Kim1
 , Shinyoung Jun2, Jeongseon Kim1
 -
Epidemiol Health 2023;45:e2023102.
DOI: https://doi.org/10.4178/epih.e2023102
Published online: November 30, 2023
1National Cancer Center Graduate School of Cancer Science and Policy, National Cancer Center, Goyang, Korea
2Department of Food Science and Nutrition, Soonchunhyang University, Asan, Korea
- Correspondence: Jeongseon Kim National Cancer Center Graduate School of Cancer Science and Policy, National Cancer Center, 323 Ilsan-ro, Ilsandong-gu, Goyang 10408, Korea E-mail: jskim@ncc.re.kr
© 2023, Korean Society of Epidemiology
This is an open-access article distributed under the terms of the Creative Commons Attribution License (http://creativecommons.org/licenses/by/4.0/), which permits unrestricted use, distribution, and reproduction in any medium, provided the original work is properly cited.
- 2,261 Views
- 128 Download
Abstract
- Cancer is a major health burden in Korea, and dietary factors have been suggested as putative risk factors for cancer development at various sites. This study systematically reviewed the published literature investigating the associations between dietary factors and cancer incidence among Korean adults, following the Preferred Reporting Items for Systematic Reviews and Meta-Analyses guidelines. We focused on the 5 most studied cancer sites (stomach, colorectum, breast, thyroid, and cervix) as outcomes and dietary exposures with evidence levels greater than limited-suggestive according to the World Cancer Research Fund/American Institute for Cancer Research (WCRF/AICR) panel’s judgment for any of the cancer sites. This resulted in the inclusion of 72 studies. Pooled estimates of the impact of dietary factors on cancer risk suggested protective associations of fruits and vegetables with risks for gastric cancer (GC), colorectal cancer (CRC), and breast cancer (BC) and dietary vitamin C with the risk of GC, as well as a harmful association between fermented soy products and the risk of GC. Despite the limited number of studies, we observed consistent protective associations of dietary fiber with GC and dietary fiber, coffee, and calcium with CRC. These findings are largely consistent with the WCRF/AICR expert report. However, pooled estimates for the associations of other salt-preserved foods with GC, meat with CRC, and dietary carotenoids and dairy products with BC did not reach statistical significance. Further studies with prospective designs, larger sample sizes, and diverse types of dietary factors and cancer sites are necessary.
- Cancer remains a leading cause of death, with the number of newly diagnosed cases continuing to increase. Some types of cancer have shown only marginal improvements in patient survival outcomes, both globally and in Korea [1,2]. Therefore, a comprehensive primary prevention strategy for cancer should be implemented to reflect changing cancer statistics [1,3].
- The elevated cancer burden may partially reflect increased life expectancy (i.e., population aging), which is a non-modifiable risk factor [4]. However, overwhelming evidence indicates that cancer pathogenesis is in part attributable to modifiable risk factors such as diet, smoking, alcohol consumption, physical inactivity, obesity, and environmental pollutants, suggesting that there is substantial potential for preventing cancer by targeting these factors [1,5-7].
- The World Cancer Research Fund/American Institute for Cancer Research (WCRF/AICR) Continuous Update Project (CUP) provided some evidence for global-scale nutritional guidelines to reduce the risk of cancer at several anatomical sites [8]. However, although numerous epidemiological studies have been conducted during the last several decades, inconsistent findings have been reported regarding many dietary components’ effects on cancer, and the cumulative evidence is insufficient to draw robust conclusions [8,9]. Moreover, some of the currently available guidelines may not be generalized to diverse populations with distinct dietary behaviors and food preparation methods (e.g., cooking, fermenting, or using condiments).
- Therefore, we aimed to summarize the evidence from observational studies on the relationship between diet and cancer in Korean adults, with the goal of informing nutritional guidelines for cancer prevention and identifying research gaps. We focused on cancers of the stomach, colorectum, breast, thyroid, and cervix, which were the most widely studied anatomical sites in relation to dietary factors in Korea. The dietary exposures were selected based on the WCRF/AICR panel’s judgment, which classified the evidence level as convincing, probable, or limited-suggestive regarding risk or protective factors for any of the cancer sites.
INTRODUCTION
- Literature search strategy
- We performed a comprehensive literature search of studies published between January 1, 2000 and December 31, 2022, in PubMed, Embase, and KoreaMed. The key search strategy included the following terms: (“diet” OR “food” OR “intake” OR “nutrition”) AND (“cancer” AND “risk”) AND (“Korea” OR “Korean”). Broad and non-specific terms such as “nutrition” were used to increase the likelihood of capturing potentially eligible studies. Articles published in English and Korean were considered. The detailed search terminologies used for each electronic database are available in Supplementary Material 1
- Literature search and study selection
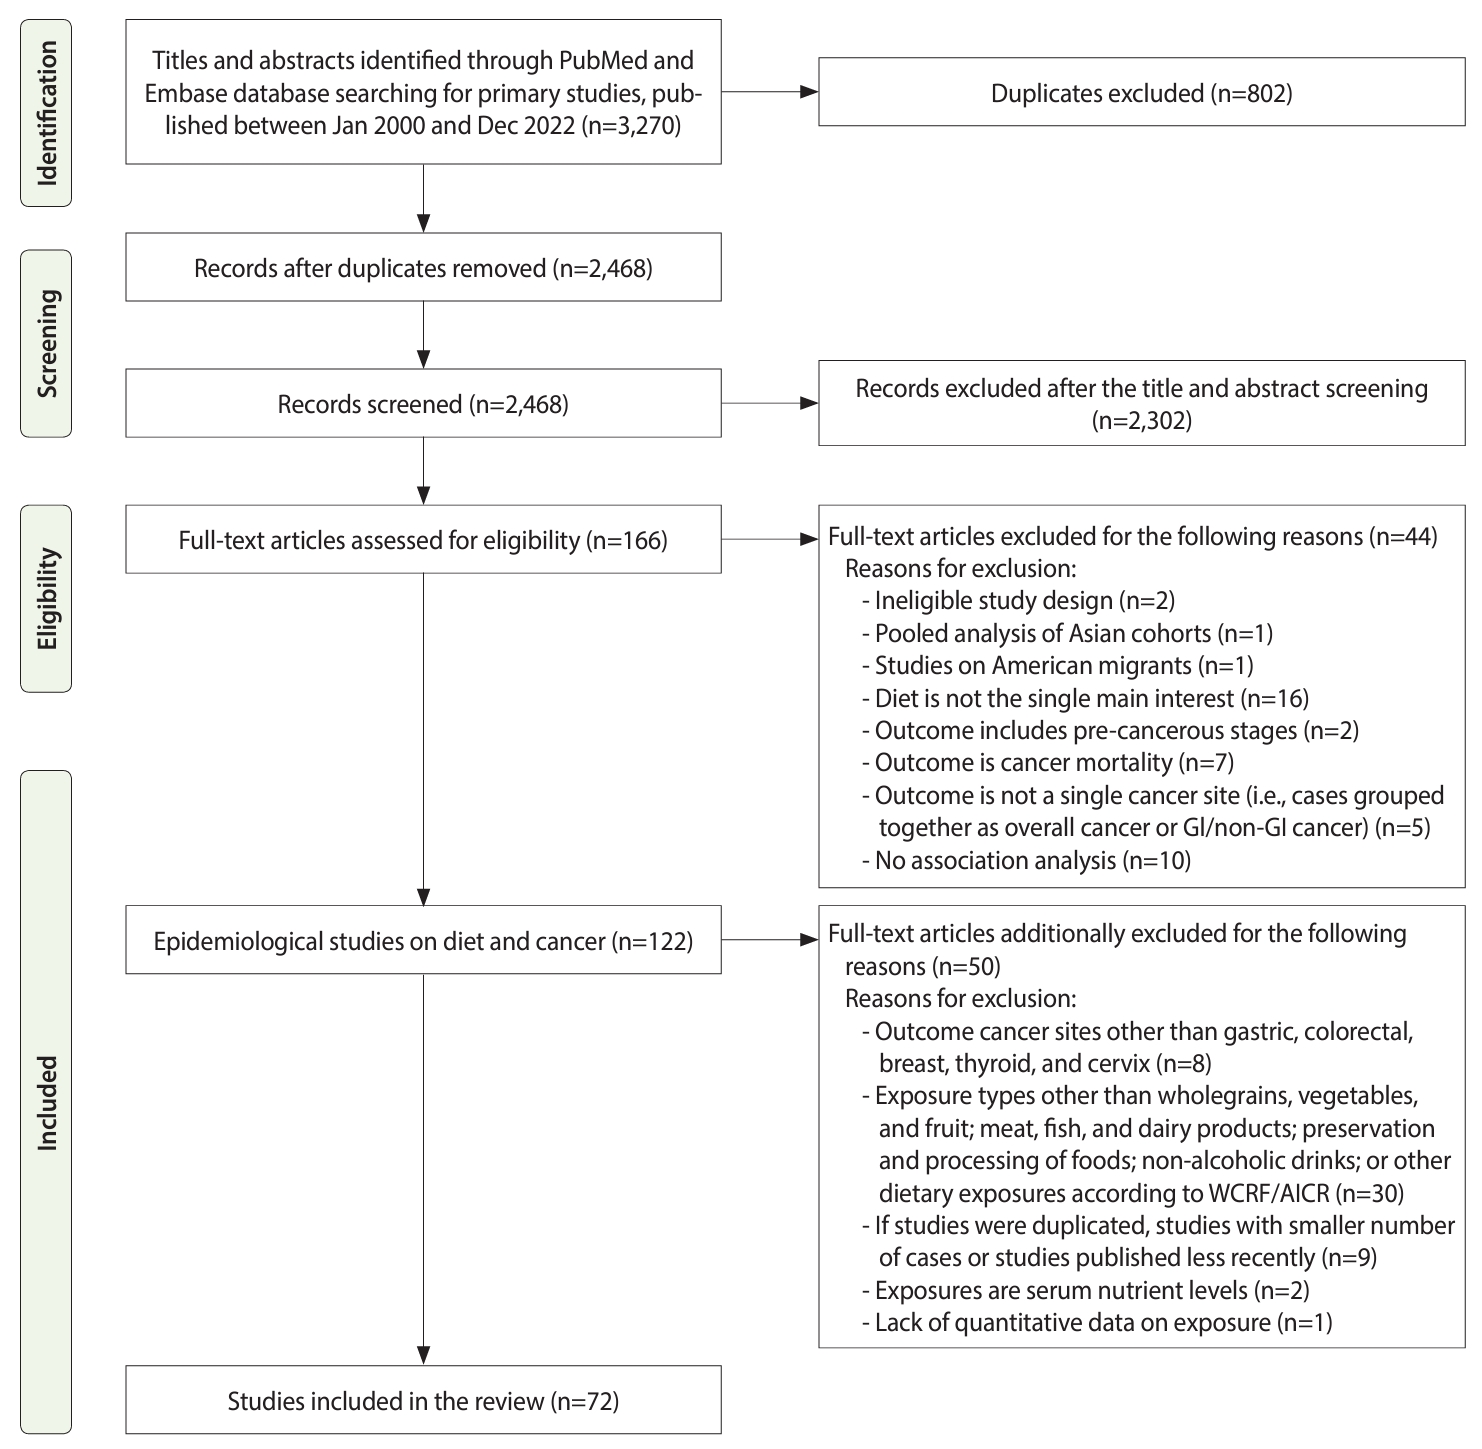
- This systematic review followed the Preferred Reporting Items for Systematic Review and Meta-Analyses guidelines (Figure 1).
- The primary inclusion criteria were as follows: (1) study subjects: Korean adults residing in Korea; (2) study design: observational studies (cohort, case-control, and cross-sectional); (3) exposure: any exposure related to dietary factors other than exposures that explicitly examined alcohol or food contaminants that can lead to the addition or generation of potential carcinogens, such as aflatoxin (e.g., food/nutrient intake and dietary patterns); and (4) outcome: cancer incidence, not recurrence or mortality.
- We further narrowed the scope with the following additional criteria: (1) exposure of interest: dietary factors that have been reported as convincing, probable, or limited-suggestive risk or protective factors for any of the cancer sites according to the WCRF/AICR CUP panel’s judgment (whole grains, fruits, and vegetables; meat, fish, and dairy products; preservation and processing of foods; non-alcoholic drinks; and other dietary exposures) [8] (Supplementary Material 2); (2) outcome of interest: the 5 most frequently studied cancer sites in the Korean population (stomach, colorectum, breast, thyroid, and cervix); and (3) if studies were duplicated (e.g., study participants, exposure dietary variables, and outcome cancer sites overlapped), we included studies with the following priority: (1) studies with a larger number of cases and (2) studies more recently published.
- The titles, abstracts, and full-texts of all the retrieved references were independently reviewed by 2 researchers (JHK and SJ), and any potential disagreements were solved through consensus or the involvement of a third researcher (JK).
- Data extraction and quality assessment
- The following data were extracted from the original publications: (1) first author and year of publication; (2) cancer site; (3) specified food items; (4) study design, enrollment year, and follow-up duration (only for cohort studies); (5) sample sizes: number of cases and number of controls for case-control studies, or number of non-cases for cross-sectional and cohort studies; (6) dietary assessment methods and dietary intake, specified as amount or frequency; and (7) main results: odds ratios (ORs) with 95% confidence intervals (CIs) for case-control or cross-sectional studies and relative risks (RRs) or hazard ratios (HRs) with 95% CIs for cohort studies.
- For quality assessment and evaluation of the risk of bias, we used the Joanna Briggs Institute Critical Appraisal Tool for Systematic Reviews [10]. The assessed methodological criteria included 11, 10, and 8 items for cohort, case-control, and cross-sectional studies, respectively. Each of them was evaluated with 4 possible answers: “yes” (criterion met), “no” (criterion not met), “unclear,” and “not applicable (N/A).” If studies had average quality scores above 0.75 (75%), they were considered “high-quality,” whereas studies with quality scores lower than 0.75 were evaluated as “low-quality.” Additionally, for each criterion, a score was calculated by dividing the number of studies with positive scores by the total number of included studies to identify how well the current literature followed the criterion.
- Data extraction and quality assessment were independently performed by 2 researchers (JHK and SJ), and inconsistencies were resolved by discussion or the involvement of a third researcher (JK).
- Data synthesis and statistical analyses
- The evidence was summarized qualitatively for each of the dietary exposure groups and the cancer sites. The results are shown by the type of cancer and dietary factor classified according to the WCRF/AICR CUP panel’s judgment [8]. The information extracted from each study included dietary factors, study design, enrollment year, duration of follow-up, sample size, dietary assessment method, multivariable-adjusted risk estimates with CIs (except for 3 studies with crude values only), and data sources. The most common covariates were demographic factors (age and gender), socioeconomic factors (education and income), lifestyle factors (smoking, drinking, and physical activity), and family history of cancer; additionally, Helicobacter pylori infection was controlled for studies on gastric cancer (GC), and reproductive-related or hormone-related factors were controlled for breast cancer (BC) and cervical cancer (CC) (Supplementary Materials 3-7).
- If 4 or more studies were available on the association between each dietary factor and cancer type, meta-analysis was performed to calculate the pooled risk estimate with a 95% CI. Heterogeneity was examined using the Higgins statistic (I2), which measures the percentage of variability across studies. Based on the heterogeneity of the included studies, fixed-effects or random-effects models were selected to calculate the pooled effect measures: when I2 was greater than 50% (substantial heterogeneity), the calculation was based on a random-effects model using the DerSimonian-Laird method, whereas if I2 was lower than 50%, the calculation was based on a fixed-effect model using the Woolf method. We also examined publication bias by using Begg’s funnel plots and Egger’s test: an asymmetric Begg’s funnel plot or a p-value < 0.05 in the Egger’s test were regarded as indicating publication bias. All analyses were performed using Stata SE version 14.0 (StataCorp., College Station, TX, USA).
- Ethics statement
- Ethical approval was not sought because this study was based on published articles, and no human or animal intervention was performed.
MATERIALS AND METHODS
- Literature search
- In total, 3,270 potential references were retrieved, 646 of which were in the PubMed database, 2,308 in the Embase database, and 316 in the KoreaMed database. After duplicates were removed, 2,468 references were screened by their titles and abstracts, and 2,302 references were excluded. The full-texts of the remaining 166 articles were assessed for eligibility, and 94 articles were subsequently excluded based on the aforementioned exclusion criteria. Finally, a total of 72 articles were included and reviewed systematically. The detailed study selection, inclusion, and exclusion processes are described in Figure 1.
- Characteristics and quality of the selected studies
- The most common cancer sites studied were the stomach (25/72) and colorectum (24/72), followed by breast (20/72), thyroid (5/72), and cervix (4/72), with some studies exploring multiple cancer sites. The year of study participant enrollment ranged from 1993 to 2016, and the sample sizes ranged from 4,513 to 2,248,129 participants for cohort studies, 155 to 3,688 participants for case-control studies, and 56,934 to 162,220 participants for cross-sectional studies. The mean age of the study participants ranged from 48.4 years to 58.1 years for cohort studies, 44.2 years to 59.6 years for case-control studies, and 53.2 years to 53.6 years for cross-sectional studies. Except for studies conducted focused on a specific gender, the proportion of men ranged from 33.8% to 70.2%. Most of the case-control studies recruited both cases and controls from primary health clinics or hospitals, while some studies used community controls. All cohort studies identified newly diagnosed cases from cancer registries. All cross-sectional studies used questionnaire-based medical histories.
- Among 72 studies that entered the review, 10 out of 10 cohort studies, 53 out of 60 case-control studies, and 2 out of 2 cross-sectional studies were evaluated as high-quality studies according to the assessment tool for systematic reviews from the Joanna Briggs Institute [10]. Supplementary Materials 8-13 present the percentage of studies meeting the quality criteria and provide detailed information on the quality score of each study.
- By cancer type
- We identified 25 studies on dietary intake and GC (Table 1) [11-35].
- Both case-control studies on dietary fiber showed significant inverse associations with the risk of GC [11,12]. Among 6 studies on fruits and vegetables, significant inverse associations with the risk of GC were observed in 3 case-control studies for fruits [15], both fruits and vegetables [17], and green vegetables [19]; however, no significant associations were observed in 2 cohort studies [13,14] and 2 case-control studies [16,18]. Three case-control studies assessed dietary carotenoid classes on GC risk. Two studies observed protective effects of lycopene [21] and β-carotene [12] on the risk of GC, while another study identified a non-significant effect of β-carotene [20].
- There were 3 studies on red meat and GC risk. A cohort study on red meat showed a non-significant association [13], whereas 2 case-control studies showed inconsistent results: a study investigating different types of red meat identified an increased risk associated with charcoal grilled beef [18], and another study found that cooked beef was associated with a reduced risk of GC [25].
- Among 7 studies on pickled vegetables, 4 case-control studies observed an elevated risk of GC, with at least 1 food item classified as kimchi [17,18,26,28]; however, no significant associations of pickled vegetables or kimchi with GC were observed in 1 cohort study [30] and 2 case-control studies [15,29]. Among fermented soy products, 2 case-control studies observed an increased risk of GC associated with soybean paste or stew [19,28], whereas a cohort study [14] and a case-control study [23] showed that the associations were non-significant. With regard to salted seafood and fish, non-significant associations with GC risk were observed in a cohort study [30] and a case-control study [18], while the associations were inconsistent in 2 case-control studies, which reported borderline increased [17] or decreased risk [26]. Among 3 studies on sodium intake, increased GC risk was observed in 2 studies (a cohort study [13] and 1 case-control study [28]), while another case-control study showed a non-significant association [12].
- Two case-control studies showed protective effects of plant-based dietary patterns on GC risk: a pattern termed the “prudent diet” derived from factor analysis with high loadings of fruits, vegetables, and other plant foods (e.g., tubers, mushrooms, tofu/soymilk, and nuts) [32] and index-based patterns on dietary antioxidant capacity, which were estimated based on the oxygen radical absorbance capacity and mainly comprised fruits and vegetables [33].
- We identified 24 studies on dietary intake and colorectal cancer (CRC) (Table 2) [13,31,36-57].
- Both case-control studies on dietary fiber and CRC risk showed significant inverse associations [36,37]. For 6 studies on fruits and vegetables, significant inverse associations with CRC risk were observed in 3 case-control studies: 1 for fruits and vegetables combined and vegetables [38], 1 for both separate groups of fruits and vegetables [37], and 1 for a group composed of banana, pear, apple, and watermelon considered protective only for men [39]; however, non-significant associations were observed in a cohort study [13] and 2 case-control studies [36,40]. There were 3 case-control studies on dietary carotenoid classes: protective effects were observed for lutein/zeaxanthin [41] and carotene [37], whereas the association was non-significant for β-carotene [36].
- With regard to meat intake, 1 cohort study [43] and 1 case-control study [40] showed that more frequent meat consumption was associated with an elevated risk of CRC; however, another case-control study did not find any significant association [44]. The results regarding red meat and CRC risk were inconclusive, especially for case-control studies: 1 for a decreased risk [45], 1 for an elevated risk [36], and 2 non-significant associations [37,46]. One cohort study on red meat also showed a non-significant association with CRC risk [13]. Among 3 case-control studies on milk and dairy products, 2 reported an increased risk of CRC [36,45], whereas another study identified a protective effect of milk on CRC [37]. Three studies investigated the association between dietary calcium and CRC risk; 2 case-control studies found inverse associations with CRC risk [37,48], whereas the association was non-significant in a cohort study [47].
- A case-control study [50] and a cross-sectional study [31] showed that coffee consumption had a protective effect on CRC.
- Saturated fatty acids were found to have significant associations with CRC risk, but the direction of associations differed across studies, with 1 study reporting a positive association [36] and 1 study reporting an inverse association [37]. Five case-control studies showed that dietary patterns highly correlated with inflammatory or insulinemic potential may significantly increase the risk of CRC. Among the studies with statistically derived patterns, one applied reduced rank regression using food groups as predictors and the plasma C-reactive protein (CRP) concentration as a response and derived the CRP-dietary pattern score, which showed inverse correlations with fruits and vegetables [54]. In another study, a pattern termed the “Westernized diet” was derived from factor analysis with high loadings of meats (red meat, meat byproducts, and poultry), high-carbohydrate foods, and oil [55]. Studies with index-based patterns were defined based on prior evidence, including components selected a priori based on the previous literature and biological plausibility. The procedure of assessing the dietary inflammatory index involved calculating scores of food parameters for inflammation based on a weighting algorithm to account for the robustness of evidence [56]. The dietary inflammation score method jointly assessed inflammation-related dietary factors by weighing each component based on its association with inflammatory biomarkers [52]. Additionally, given that cumulative evidence has suggested mechanical linkages between insulin levels and colorectal carcinogenesis, the insulinemic potential of diets (empirical dietary indices for hyperinsulinemia and insulin resistance) was calculated by utilizing indices based on food groups contributing to hyperinsulinemia (C-peptide) and insulin resistance (triacylglycerol: high-density lipoprotein cholesterol) and was consequently weighted by the regression coefficients [53].
- We identified 20 studies on dietary intake and BC (Table 3) [31,58-76].
- In 6 studies on fruits and vegetables, significant inverse associations with BC risk were observed in 3 case-control studies for combined fruits and vegetables, vegetables, and non-pickled vegetables [61], fruits [63], and fruits and green vegetables, but not for white vegetables [64]. Non-significant associations were observed in a cohort study [60] and a case-control study [62].
- For any type of meat, an elevated risk of BC was observed in a cohort study of grilled ribs or barbecue [60] and in a case-control study on meat, including beef, pork, and chicken [64]; however, the other 2 case-control studies did not find any significance [59,63]. The results were conflicting among 5 studies on fish: significant protective associations with the risk of BC were found in a case-control study on total and fatty fish [70], whereas another case-control study indicated an increased risk of BC among those who consumed total fish (any kind) more frequently [64]. However, a cohort study [60] and 2 case-control studies [59,63] did not report any significant findings.
- The glycemic index showed significant associations with BC risk, but the direction of associations differed across studies: 1 for an increased risk [74] and 1 for a reduced risk [76]. One cohort study and 2 case-control studies showed that dietary patterns highly correlated with inflammatory or glycemic responses may significantly increase the risk of BC. With regard to inflammation, there was a study on an index-based dietary inflammatory index [73]. Additionally, in studies with statistically derived patterns, a pattern termed the “white rice diet” was derived from factor analysis with high loadings of white rice and lower loadings of multigrain rice [72], and a study applied reduced rank regression using food groups as predictors and glycemic index or glycemic load as responses, where grain intake explained most of the variance in the factor scores in both glycemic patterns [74].
- We identified 5 studies on dietary intake and thyroid cancer (TC) (Table 4) [13,31,77-79]. Dietary calcium, coffee, higher adherence to noodle/meat pattern, and lower adherence to prudent pattern were associated with a reduced risk of TC; however, these results were found only in 1 study.
- We identified 4 studies on dietary intake and CC (Table 5) [31,80-82]. Dietary vitamin C was associated with a decreased risk of CC, while the dietary inflammatory index was correlated with a borderline increased risk of CC. However, those results were based on only 1 study.
- Results of meta-analysis
- Table 6 shows the results of a meta-analysis of the impact of dietary factors on cancer risk for exposure-outcome pairs with 4 or more observational studies. In this analysis, the consumption of fruits and vegetables (highest vs. lowest) was significantly associated with a decreased risk of GC, CRC, and BC in a random-effects model (GC: OR, 0.59; 95% CI, 0.40 to 0.86; I2= 82.2%; CRC: OR, 0.63; 95% CI, 0.49 to 0.80; I2= 51.4%; BC: OR, 0.72; 95% CI, 0.53 to 0.98; I2= 77.0%). Total fruit intake was associated with a reduced risk of CRC in a fixed-effect model (OR, 0.69; 95% CI, 0.56 to 0.86; I2= 23.2%) but not for GC and BC in a random-effects model. Total vegetable intake was inversely associated with GC and CRC in a random-effects model (GC: OR, 0.54; 95% CI, 0.32 to 0.90; I2= 84.6%; CRC: OR, 0.58; 95% CI, 0.42 to 0.80; I2= 62.4%) but was non-significant for BC in a fixed-effect model. Dietary vitamin C was also inversely associated with GC risk in the fixed-effect model (OR, 0.74; 95% CI, 0.59 to 0.92; I2= 0.0%), and fermented soy products were positively associated with GC risk in a random-effects model (OR, 1.56; 95% CI, 1.08 to 2.27; I2= 56.3%). For those results, except for the associations between salt-preserved vegetables and GC, no evidence of publication bias was observed. The Begg’s funnel plots were symmetric, and the p-values for bias using the Egger’s test were > 0.05 (Supplementary Materials 14-34).
RESULTS
Gastric cancer
Whole grains, fruits, and vegetables
Meat, fish, and dairy products
Preservation and processing of foods
Other dietary exposures
Colorectal cancer
Whole grains, fruits, and vegetables
Meat, fish, and dairy products
Non-alcoholic drinks
Other dietary exposures
Breast cancer
Whole grains, fruits, and vegetables
Meat, fish, and dairy products
Other dietary exposures
Thyroid cancer
Cervical cancer
- In this systematic review, we summarized relatively recent publications on dietary intake and the risks of major cancers among the Korean adult population. A substantial number of studies were published recently or conducted since the publication of previous review articles on diet and cancer among Koreans in 2011 and 2014 [83,84], including studies on TC [77-79]; CC [80,81]; cancer at diverse anatomical sites [31]; GC in relation to specific food items and nutrients [11,15,20-24,26,27,29,30], dietary pattern [32-34], and the glycemic index [35]; CRC in relation to specific food items and nutrients [36,41,42,45-51], dietary patterns [52-56], colors of foods [38], and the glycemic index [57]; and BC in relation to specific food items and nutrients [59,60,66,68,71], dietary patterns [72-75], and the glycemic index [74]. Some studies have also explored gene and diet interactions in GC [11,23,26,27,33] and CRC [41,42,45,46,53,54,57].
- The pooled estimates of dietary factors on cancer risk suggested protective associations of fruits and vegetables with the risks of GC, CRC, and BC and of dietary vitamin C with that of GC, as well as a harmful association of fermented soy products with the risk of GC. In addition, despite the limited number of previous studies, we observed consistent trends for inverse associations of dietary fiber with GC risk and of dietary fiber, coffee, and calcium with CRC risk. The results were null or insufficient for other foods preserved by salting (vegetables and seafood/fish) and grilled meat/fish in relation to the risk of GC; red or processed meat, dairy products, fish, heme iron, and vitamin C and D in relation to the risk of CRC; and dietary carotenoids, dairy products, and calcium in relation to the risk of BC. We compared our findings with those from the most recent WCRF/AICR report [8] and discussed plausible mechanisms underlying each finding below.
- The impact of foods preserved by salting on gastric cancer
- The findings of this review showed that fermented soybean paste containing a substantial amount of salt had a positive association with GC. This result is in line with the WCRF/AICR’s latest report, which concluded that there is probable evidence to support that foods preserved by salting may increase GC risk, because the increased intragastric sodium concentration can damage the stomach mucosal barrier, leading to atrophic gastritis and H. pylori colonization [8,85]. H. pylori-associated gastritis may increase endogenous nitrite synthesis and decrease intragastric vitamin C secretion, thereby increasing the formation of endogenous N-nitroso compounds [86,87]. Moreover, the processing and storage of vegetables or soy products under acidic or oxygenic conditions with greater amounts of salt may consequently lead to the loss of antioxidant nutrients [86,88].
- The impact of fruits or vegetables on gastric cancer, colorectal cancer, breast cancer, and dietary fiber/coffee on colorectal cancer
- This review supports WCRF/AIRC’s probable evidence indicating that consuming greater amounts of foods containing dietary fiber may decrease the risk of CRC and the limited-suggestive evidence for fruits or vegetables and the risks of GC, CRC, and BC [8]. Fruits and vegetables are rich sources of bioactive compounds (e.g., vitamins such as vitamin C, minerals such as calcium, and phytochemicals such as carotenoids), and the variability of choices may further synergistically enhance the effects of constituents on molecular mechanisms through their antioxidant and anti-inflammatory properties, which trigger diverse signaling pathways to prevent cancer [89,90]. In addition to these health-promoting substances, plant foods also contain fiber, which can also shorten the intestinal transit time and dilute carcinogenic contents in the intestine [91]. The anaerobic fermentation of fiber in the intestine by gut bacteria produces short-chain fatty acids, which can stimulate the secretion of hormones (GLP-1, PYY) that assist glucose metabolism (e.g., increasing insulin secretion and controlling blood glucose levels), thereby playing a key role in cancer prevention [91]. Additionally, a beneficial effect of coffee on CRC was observed in this review, probably due to the antioxidant and anti-inflammatory properties of its phytochemicals (e.g., polyphenols and melanoidins), which protect against inflammation-triggered carcinogenesis [92]. However, the WCRF/AICR report contains limited or no conclusions regarding CRC and coffee consumption [8].
- The impact of meat intake on colorectal cancer
- In this meta-analysis, non-significant results were observed for the effect of meat on CRC, probably due to the limited number of studies and the lower meat consumption in Korea compared to other countries. Nevertheless, several publications in this review suggested that consuming meat more frequently is a risk factor for CRC, although the exact types of meat were not clarified. Red and processed meat have been judged as probable and convincing risk factors according to the WCRF/AICR report and were classified as group 2A (probable carcinogen) and group 1 (carcinogen) for humans according to the International Agency for Research on Cancer, respectively [8,93]. When meat is cooked at high temperatures (e.g., grilling, barbecuing, panfrying muscle meat, or cooking over a direct flame) or processed (e.g., curing and smoking), carcinogenic chemicals such as polycyclic aromatic hydrocarbons and heterocyclic amines are formed, and they can play a key role in the pathogenesis of CRC through the increased production of DNA adducts [93]. The heme iron content of red and processed meat can catalyze the formation of N-nitroso compounds and can induce lipid peroxidation in intestinal epithelial cells, which may be responsible for gene alterations [94].
- The impact of dietary calcium and dairy products on colorectal cancer
- To evaluate the quality of evidence, an umbrella review was conducted with meta-analyses from the WCRF/AICR report. From this evaluation, a strong association between calcium and a lower risk of CRC has been inferred by the strength and significance of results with less bias [95]. Concordant with this study, 2 out of 3 publications that we identified showed a reduced risk of CRC. Dietary calcium can directly affect cell proliferation and differentiation and participate in a cascade of intercellular connections and signal transduction, influencing cell cycle regulatory genes that are involved in colorectal carcinogenesis [96]. Additionally, dietary calcium can bind to bile acids in the intestinal lumen and form insoluble calcium soaps, which can further protect the mucous membrane from the cytotoxicity caused by fatty acids [96,97]. WCRF/AICR has reported a probable reduced risk of CRC development due to dairy products, which has been largely attributed to their calcium content [8,95]. However, our results showed inconclusive findings, as 1 study reported protective effects of dairy products on CRC, whereas 2 out of 3 studies showed increased CRC risk in individuals who consumed more dairy products.
- We could not draw any conclusions from studies on TC and CC. This is not surprising because TC is not generally recognized to have a relationship with diet [8]. However, we included the results for TC because it is the most frequent cancer in Korea [2], with the aim of identifying any potential dietary factors linked to TC in the Korean population. Similarly, the WCRF/AICR systematic literature review on CC could not draw any evidence for dietary variables [8,98], but we included this site because it was 1 of the top 5 most frequently studied anatomical sites in relation to dietary factors in Korea.
- Our review faced several challenges, some of which may be due to research gaps in diet-cancer epidemiological studies among Korean adults. First, specifying single dietary factors was challenging because foods were often grouped together (e.g., all types of meat grouped as “meat” instead of a specific distinction between red meat and other types of meat, and “total fruits and vegetables” instead of separate analyses of fruits and vegetables), especially for studies conducted earlier. Further studies disaggregating mixed dishes into component parts are warranted to better estimate the exact intake of specific food items. Moreover, large variations in dietary assessment tools (e.g., studies that use validated food frequency questionnaires vs. short-form questionnaires based on intake frequency) and discrepancies in study design and exposure classification made it difficult to compare different studies. Our findings should be interpreted cautiously because the majority of publications selected in this review had case-control (60/72) and cross-sectional (2/72) designs. Unless exposures remain stable over time and are not affected by the outcome, those designs are prone to bias (e.g., selection and information), leading to weaker evidence of causality compared to a cohort design. Last, some cancer sites with high incidence rates in Korea (e.g., prostate, lung, liver, and pancreas) have not been extensively studied in relation to diet. Based on these challenges, we proposed areas of focus for future epidemiological research on dietary intake and cancer risks in Korea (Table 7).
DISCUSSION
- This study reviewed the recent literature on the associations between dietary factors and cancer risks among Korean adults. By pooling the estimates of observational studies, we found protective associations of fruits and vegetables with GC, CRC, and BC risk and dietary vitamin C with GC risk, as well as a harmful association of fermented soy products with GC risk. In addition, despite limited numbers of studies, protective associations were observed between dietary fiber and GC risk as well as dietary fiber, coffee, and calcium with CRC risk. These findings are highly concordant with the expert report provided by the WCRF/AICR based on a series of meta-analyses at a global scale.
- However, other findings of the present study did not fully support the WCRF/AICR report. In the current meta-analysis, nonsignificant associations were observed for pickled vegetables and salted seafood/fish with GC risk, red meat with CRC risk, and dietary carotenoids and dairy products with the risk of BC. Furthermore, this study identified insufficient evidence for the associations of grilled meat and fish with GC risk, processed meat, dairy products, fish, heme iron, and vitamins C and D with CRC risk, and dietary calcium with BC risk. Further studies focusing on the longitudinal designs, larger sample sizes, and diverse dietary factors with a comprehensive list of cancer types are warranted.
CONCLUSION
SUPPLEMENTARY MATERIALS
Supplement Material 1.
Supplement Material 2.
Supplement Material 3.
Supplement Material 4.
Supplement Material 5.
Supplement Material 6.
Supplement Material 7.
Supplement Material 8.
Supplement Material 9.
Supplement Material 10.
Supplement Material 11.
Supplement Material 12.
Supplement Material 13.
Supplement Material 14-1.
Supplement Material 14-2.
Supplement Material 15-1.
Supplement Material 15-2.
Supplement Material 16-1.
Supplement Material 16-2.
Supplement Material 17-1.
Supplement Material 17-2.
Supplement Material 18-1.
Supplement Material 18-2.
Supplement Material 19-1.
Supplement Material 19-2.
Supplement Material 20-1.
Supplement Material 20-2.
Supplement Material 21-1.
Supplement Material 21-2.
Supplement Material 22-1.
Supplement Material 22-2.
Supplement Material 23-1.
Supplement Material 23-2.
Supplement Material 24-1.
Supplement Material 24-2.
Supplement Material 25-1.
Supplement Material 25-2.
Supplement Material 26-1.
Supplement Material 26-2.
Supplement Material 27-1.
Supplement Material 27-2.
Supplement Material 28-1.
Supplement Material 28-2.
Supplement Material 29-1.
Supplement Material 29-2.
Supplement Material 30-1.
Supplement Material 30-2.
Supplement Material 31-1.
Supplement Material 31-2.
Supplement Material 32-1.
Supplement Material 32-2.
Supplement Material 33-1.
Supplement Material 33-2.
Supplement Material 34-1.
Supplement Material 34-2.
-
CONFLICT OF INTEREST
The authors have no conflicts of interest to declare for this study.
-
FUNDING
This research was supported by the National Research Foundation of Korea (2021R1A2C2008439 and 2021R1A6A3A01087058).
NOTES
ACKNOWLEDGEMENTS
| Dietary factors | Study design, enrollment year, follow-up duration (yr) | Sample size (cases/controls, non-cases), age (yr), % of men | Diet assessment, amount or frequency |
Risk estimate |
Sources | Year [Ref] | ||
|---|---|---|---|---|---|---|---|---|
| Category | Type | Effect (95% CI) | ||||||
| Whole grains, fruits, and vegetables | ||||||||
| Dietary fiber (2 studies) | ||||||||
| Dietary fiber | Case-control, 2011-2014 | 377/756, mean age: 53.8, men: 65.6 | 106-item FFQ, amount | T3 vs. T1 (reference) | OR | 0.37 (0.24, 0.57) | National Cancer Center | 2022 [11] |
| Dietary fiber | Case-control, 1997-1998 | 136/136, mean age: 57.2, men: 68.4 | 109-item FFQ, amount | Q4 vs. Q1 (reference) | OR | 0.37 (0.17, 0.79) | Hanyang and Hallym University Hospital | 2005 [12] |
| Fruits and vegetables (7 studies) | ||||||||
| Fruits and vegetables | Cohort, 2004-2008, median follow-up: 7.0 | 46/7,637, mean age: 48.4, men: 54.8 | 3-day DR, amount | ≥600 vs. <600 g/day (reference) | HR | 0.83 (0.35, 1.98) | National Cancer Center | 2014 [13] |
| Fruits | Cohort, 1993-2004, mean follow-up: 8.5 | 166/9,558, mean age: 57.6, men: 68 | 14-item brief FFQ, frequency | ≥1 time/day vs. almost never (reference) | RR | 1.10 (0.55, 2.22) | Korean Multi-Center Cancer Cohort | 2013 [14] |
| Vegetables | ≥1 time/day vs. almost never (reference) | 0.68 (0.27, 1.68) | ||||||
| Fruits | Case-control, 2011-2014 | 415/830, mean age: 53.7, men: 65.1 | 106-item FFQ, amount | T3 vs. T1 (reference) | OR | 0.59 (0.41, 0.85) | National Cancer Center | 2016 [15] |
| Vegetables | T3 vs. T1 (reference) | 0.96 (0.68, 1.34) | ||||||
| Fresh vegetables | Case-control, 1997-2003 | 421/632, mean age: 59.6, men: 65.5 | 84-item FFQ, amount | Upper vs. lower median (reference) | OR | 0.92 (0.72, 1.17) | Chungbuk and Eulji University Hospital | 2005 [16] |
| Fruits | Case-control, 1999 | 69/199, most frequent age range: 41-55, men: 61.9 | 161-item FFQ, frequency | >6 vs. <4/wk (reference) | OR | 0.30 (0.10, 0.70) | Asan Medical Center | 2003 [17] |
| Raw vegetables | >5 vs. <3/wk (reference) | 0.20 (0.10, 0.50) | ||||||
| Fruits | Case-control, 1997-1998 | 136/136, mean age: 57.2, men: 68.4 | 109-item FFQ, amount | Q4 vs. Q1 (reference) | OR | 0.67 (0.33, 1.39) | Hanyang and Hallym University Hospital | 2002 [18] |
| Vegetables | 0.64 (0.31, 1.32) | |||||||
| Green vegetables | Case-control, 1997-1999 | 204/204, mean age: 59.5, men: 68.8 | 84-item FFQ, frequency | ≥1/wk vs. <1/mo (reference) | OR | 0.24 (0.14, 0.41) | Chungbuk National University Hospital | 2000 [19] |
| Dietary carotenoids (3 studies) | ||||||||
| Dietary β-carotene | Case-control, 2002-2006 | 286/286, mean age: 56.8, men: 66.4 | 102, 115-item FFQ, amount | Q4 vs. T1 (reference) | OR | 0.97 (0.60, 1.56) | Hanyang and Chungnam National University Hospital | 2022 [20] |
| Dietary total carotenoids | Case-control, 2011-2014 | 415/830, mean age: 53.7, men: 65.1 | 106-item FFQ, amount | T3 vs. T1 (reference) | OR | 0.79 (0.55, 1.15) | National Cancer Center | 2018 [21] |
| Dietary α-carotene | T3 vs. T1 (reference) | 1.00 (0.70, 1.41) | ||||||
| Dietary β-carotene | T3 vs. T1 (reference) | 0.85 (0.59, 1.22) | ||||||
| Dietary β-cryptoxanthin | T3 vs. T1 (reference) | 0.77 (0.54, 1.10) | ||||||
| Dietary lutein/zeaxanthin | T3 vs. T1 (reference) | 0.91 (0.64, 1.30) | ||||||
| Dietary lycopene | T3 vs. T1 (reference) | 0.60 (0.42, 0.85) | ||||||
| Dietary β-carotene | Case-control, 1997-1998 | 136/136, mean age: 57.2, men: 68.4 | 109-item FFQ, amount | Q4 vs. Q1 (reference) | OR | 0.35 (0.16, 0.75) | Hanyang and Hallym University Hospital | 2005 [12] |
| Dietary vitamin C (4 studies) | ||||||||
| Dietary vitamin C | Case-control, 2002-2006 | 286/286, mean age: 56.8, men: 66.4 | 102, 115-item FFQ, amount | Q4 vs. T1 (reference) | OR | 0.84 (0.52, 1.36) | Hanyang and Chungnam National University Hospital | 2022 [20] |
| Dietary vitamin C | Case-control, 2011-2014 | 415/830, mean age: 53.7, men: 65.1 | 106-item FFQ, amount | T3 vs. T1 (reference) | OR | 0.71 (0.50, 1.00) | National Cancer Center | 2016 [15] |
| Dietary vitamin C | Case-control, 1997-1998 | 136/136, mean age: 57.2, men: 68.4 | 109-item FFQ, amount | Q4 vs. Q1 (reference) | OR | 0.55 (0.27, 1.12) | Hanyang and Hallym University Hospital | 2005 [12] |
| Dietary vitamin C | Case-control, 1997-1998 | 295/295, mean age: 49.3, men: 70.2 | 84-item FFQ, amount | >93.3 vs. ≤93.3 mg/day (reference) | OR | 0.79 (0.52, 1.21) | Seoul National University Hospital and Asan Medical Center | 2005 [22] |
| Dietary isoflavone (1 study) | ||||||||
| Dietary isoflavone | Case-control, 2011-2014 | 377/754, mean age: 53.8, men: 65.3 | 106-item FFQ, amount | T3 vs. T1 (reference) | OR | 0.70 (0.49, 1.00) | National Cancer Center | 2017 [23] |
| Meat, fish, and dairy products | ||||||||
| Meat (5 studies) | ||||||||
| Meat | Cohort, 1993-2004, mean follow-up: 8.5 | 166/9,558, mean age: 57.6, men: 68.4 | 14-item brief FFQ, frequency | ≥1 time/day vs. almost never (reference) | RR | 0.88 (0.30, 2.60) | Korean Multi-Center Cancer Cohort | 2013 [14] |
| Meat | Cohort, 1996-1997, follow-up: 6-7 | 12,393/2,235,736, most frequent age range: 50-59, men: 63.2 | A single question, frequency | ≥4 vs. ≤1/wk | HR | 0.99 (0.93, 1.07) | Korean Health Insurance Cooperation | 2010 [24] |
| Red meat | Cohort, 2004-2008, median follow-up: 7.0 | 46/7,637, mean age: 48.4, men: 54.8 | 3-day DR, amount | ≥600 vs. <600 g/day (reference) | HR | 1.16 (0.56, 2.41) | National Cancer Center | 2014 [13] |
| Total beef | Case-control, 1997-1998 | 136/136, mean age: 57.2, men: 68.4 | 109-item FFQ, amount | Q4 vs. Q1 (reference) | OR | 1.67 (0.86, 3.27) | Hanyang and Hallym University Hospital | 2002 [18] |
| Total pork | Q4 vs. Q1 (reference) | 0.94 (0.45, 1.97) | ||||||
| Cooked beef | Case-control, 2000 | 69/199, most frequent age range: 41-55, men: 61.9 | 161-item FFQ, frequency | ≥1 vs. <1/mo (reference) | OR | 0.40 (0.20, 0.80) | Asan Medical Center | 2002 [25] |
| Grilled meat and fish (2 studies) | ||||||||
| Fried meat and fish | Case-control, 1997-1998 | 136/136, mean age: 57.2, men: 68.4 | 109-item FFQ, amount | Q4 vs. Q1 (reference) | OR | 0.73 (0.36, 1.48) | Hanyang and Hallym University Hospital | 2002 [18] |
| Charcoal grilled beef | Case-control, 1997-1998 | 136/136, mean age: 57.2, men: 68.4 | 109-item FFQ, amount | Q4 vs. Q1 (reference) | OR | 2.11 (1.17, 3.82) | Hanyang and Hallym University Hospital | 2002 [18] |
| Charcoal grilled beef and pork | Q4 vs. Q1 (reference) | 1.58 (0.80, 3.10) | ||||||
| Fish (3 studies) | ||||||||
| Fresh fish | Cohort, 1993-2004, mean follow-up: 8.5 | 166/9,558, mean age: 57.6, men: 68.4 | 14-item brief FFQ, frequency | ≥1 time/day vs. almost never (reference) | RR | 1.46 (0.65, 3.28) | Korean Multi-Center Cancer Cohort | 2013 [14] |
| Raw fish | Case-control, 1997-2001 | 214/214, mean age: 58.8, men: 67.5 | 89-item FFQ, amount | Upper vs. lower median (reference) | OR | 0.68 (0.46, 1.01) | Chungbuk National and Eulji University Hospital | 2003 [26] |
| Slices of raw fish | Case-control, 1997-1999 | 204/204, mean age: 59.5, men: 68.8 | 84-item FFQ, frequency | ≥1/wk vs. <1/mo (reference) | OR | 0.43 (0.04, 4.81) | Chungbuk National University Hospital | 2000 [19] |
| Dairy products (2 studies) | ||||||||
| Dairy product | Cohort, 1993-2004, mean follow-up: 8.5 | 166/9,558, mean age: 57.6, men: 68.4 | 14-item brief FFQ, frequency | ≥1 time/day vs. almost never (reference) | RR | 1.30 (0.83, 2.06) | Korean Multi-Center Cancer Cohort | 2013 [14] |
| Dairy product | Case-control, 1997-1998 | 136/136, mean age: 57.2, men: 68.4 | 109-item FFQ, amount | Q4 vs. Q1 (reference) | OR | 0.68 (0.34, 1.36) | Hanyang and Hallym University Hospital | 2002 [18] |
| Dietary iron (3 studies) | ||||||||
| Dietary total iron | Case-control, 2011-2014 | 374/754, mean age: 53.8, men: 65.6 | 106-item FFQ, amount | T3 vs. T1 (reference) | OR | 0.65 (0.45, 0.94) | National Cancer Center | 2021 [27] |
| Dietary non-heme iron | T3 vs. T1 (reference) | 0.64 (0.44, 0.92) | ||||||
| Dietary heme iron | T3 vs. T1 (reference) | 0.81 (0.56, 1.17) | ||||||
| Dietary iron | Case-control, 2000-2005 | 471/471, mean age: 58.5, men: 66.9 | 89-item FFQ, amount | Upper vs. lower median (reference) | OR | 0.77 (0.59, 1.02) | Chungbuk National and Eulji University Hospital | 2009 [28] |
| Dietary iron | Case-control, 1997-1998 | 136/136, mean age: 57.2, men: 68.4 | 109-item FFQ, amount | Q4 vs. Q1 (reference) | OR | 0.49 (0.24, 1.01) | Hanyang and Hallym University Hospital | 2005 [12] |
| Dietary calcium (1 study) | ||||||||
| Dietary calcium | Case-control, 1997-1998 | 136/136, mean age: 57.2, men: 68.4 | 109-item FFQ, amount | Q4 vs. Q1 (reference) | OR | 0.43 (0.21, 0.90) | Hanyang and Hallym University Hospital | 2005 [12] |
| Preservation and processing of foods | ||||||||
| Pickled vegetables and kimchi (7 studies) | ||||||||
| Pickled vegetables | Case-control, 2002-2006 | 307/307, mean age: 56.6, men: 67.1 | 103/116-item FFQ, amount | T3 vs. T1 (reference) | OR | 0.80 (0.52, 1.24) | Chungnam National and Hanyang University Hospital | 2021 [29] |
| Pickled vegetables | Cohort, 1993-2004, mean follow-up: 10.3 | 81/4,432, mean age: 58.1, men: 38.4 | 14-item brief FFQ, frequency | Per 40 g/day increment | RR | 0.95 (0.80, 1.13) | Korean Multi-Center Cancer Cohort | 2020 [30] |
| Korean cabbage kimchi | Case-control, 2011-2014 | 415/830, mean age: 53.7, men: 65.1 | 106-item FFQ, amount | T3 vs. T1 (reference) | OR | 1.11 (0.80, 1.55) | National Cancer Center | 2016 [15] |
| Radish kimchi | T3 vs. T1 (reference) | 0.80 (0.57, 1.12) | ||||||
| Chonggak kimchi | T3 vs. T1 (reference) | 0.81 (0.58, 1.13) | ||||||
| Kimchi | Case-control, 2000-2005 | 471/471, mean age: 58.5, men: 66.9 | 89-item FFQ, amount | Upper vs. lower median (reference) | OR | 3.27 (2.44, 4.37) | Chungbuk National and Eulji University Hospital | 2009 [28] |
| Kimchi | Case-control, 1999 | 69/199, most frequent age range: 41-55, | 161-item FFQ, frequency | ≥2 vs. <2/day (reference) | OR | 1.90 (1.30, 2.80) | Asan Medical Center | 2003 [17] |
| Kimchi | Case-control, 1997-2001 | men: 61.9 214/214, mean age: 58.8, men: 67.5 | 89-item FFQ, amount | Upper vs. lower median (reference) | OR | 1.51 (1.12, 2.44) | Chungbuk National and Eulji University Hospital | 2003 [26] |
| Baiechu kimchi | Case-control, 1997-1998 | 136/136, mean age: 57.2, men: 68.4 | 109-item FFQ, amount | Q4 vs. Q1 (reference) | OR | 0.50 (0.25, 1.01) | Hanyang and Hallym University Hospital | 2002 [18] |
| Baiechu kimchi stew | Q4 vs. Q1 (reference) | 0.62 (0.29, 1.35) | ||||||
| Kkakduki | Q4 vs. Q1 (reference) | 1.78 (0.85, 3.73) | ||||||
| Dongchimi | Q4 vs. Q1 (reference) | 1.96 (1.01, 3.83) | ||||||
| Salted seafood and fish (4 studies) | ||||||||
| Salted fish | Cohort, 1993-2004, mean follow-up: 12.9 | 296/11,026 mean age: 57.4, men: 39.1 | 14-item brief FFQ, frequency | Per 60 g/day increment | RR | 1.01 (0.63, 1.61) | Korean Multi-Center Cancer Cohort | 2020 [30] |
| Salt-fermented fish | Case-control, 1999 | 69/199, most frequent age range: 41-55, men: 61.9 | 161-item FFQ, frequency | ≥1 vs. <1/mo (reference) | OR | 2.40 (1.00, 5.70) | Asan Medical Center | 2003 [17] |
| Salted seafood | Case-control, 1997-2001 | 214/214, mean age: 58.8, men: 67.5 | 89-item FFQ, amount | Upper vs. lower median (reference) | OR | 0.67 (0.45, 1.00) | Chungbuk National and Eulji University Hospital | 2003 [26] |
| Salted fish and shellfish | Case-control, 1997-1998 | 136/136, mean age: 57.2, men: 68.4 | 109-item FFQ, amount | Q4 vs. Q1 (reference) | OR | 0.78 (0.39, 1.56) | Hanyang and Hallym University Hospital | 2002 [18] |
| Fermented soy products (4 studies) | ||||||||
| Fermented soy paste | Case-control, 2011-2014 | 377/754, mean age: 53.8, men: 65.3 | 106-item FFQ, amount | T3 vs. T1 (reference) | OR | 1.08 (0.77, 1.51) | National Cancer Center | 2017 [23] |
| Soybean paste | Cohort, 1993-2004, mean follow-up: 8.5 | 166/9,558, mean age: 57.6, men: 68.4 | 14-item brief FFQ, frequency | ≥1 time/day vs. almost never (reference) | RR | 2.01 (0.52, 8.50) | Korean Multi-Center Cancer Cohort | 2013 [14] |
| Soybean paste | Case-control, 2000-2005 | 471/471, mean age: 58.5, men: 66.9 | 89-item FFQ, amount | Upper vs. lower median (reference) | OR | 1.63 (1.24, 2.14) | Chungbuk National and Eulji University Hospital | 2009 [28] |
| Soybean paste stew | Case-control, 1997-1999 | 204/204, mean age: 59.5; men: 68.8 | 84-item FFQ, frequency | ≥1/wk vs. <1/mo (reference) | OR | 2.73 (1.34, 5.56) | Chungbuk National University Hospital | 2000 [19] |
| Sodium (3 studies) | ||||||||
| Sodium | Cohort, 2004-2008, median follow-up: 7.0 | 46/7,637, mean age: 48.4, men: 54.8 | 3-day DR, amount | ≥4,000 vs. <4,000 mg/day (reference) | HR | 2.34 (1.05, 5.19) | National Cancer Center | 2014 [13] |
| Sodium | Case-control, 2000-2005 | 471/471, mean age: 58.5, men: 66.9 | 89-item FFQ, amount | Upper vs. lower median (reference) | OR | 2.30 (1.61, 3.30) | Chungbuk National and Eulji University Hospital | 2009 [28] |
| Sodium | Case-control, 1997-1998 | 136/136, mean age: 57.2, men: 68.4 | 109-item FFQ, amount | Q4 vs. Q1 (reference) | OR | 0.56 (0.28, 1.11) | Hanyang and Hallym University Hospital | 2005 [12] |
| Non-alcoholic drinks | ||||||||
| Coffee (2 studies) | ||||||||
| Coffee | Cross-sectional, 2004-2016 | 976/161,244, mean age: 53.2, men: 34.3 | 106-item FFQ, frequency | >60 cups/mo vs. no drink (reference) | OR | 0.80 (0.65, 0.98) | KoGES-HEXA | 2021 [31] |
| Coffee | Cohort, 1993-2004, mean follow-up: 8.5 | 166/9,558, mean age: 57.6, men: 68.4 | 14-item brief FFQ, frequency | ≥1 time/day vs. almost never (reference) | RR | 0.94 (0.63, 1.41) | Korean Multi-Center Cancer Cohort | 2013 [14] |
| Tea (2 studies) | ||||||||
| Citrus tea | Case-control, 2011-2014 | 415/830, mean age: 53.7, men: 65.1 | 106-item FFQ, amount | T3 vs. T1 (reference) | OR | 0.83 (0.59, 1.18) | National Cancer Center | 2016 [15] |
| Tea | Case-control, 1997-1999 | 204/204, mean age: 59.5, men: 68.8 | 84-item FFQ, frequency | ≥1/wk vs. <1/mo (reference) | OR | 0.32 (0.06, 1.61) | Chungbuk National University Hospital | 2000 [19] |
| Other dietary exposures | ||||||||
| Dietary pattern (3 studies) | ||||||||
| Factor analysis: Westernized | Case-control, 2011-2014 | 415/830, mean age: 53.7, men: 65.1 | 106-item FFQ, amount | T3 vs. T1 (reference) | OR | 0.76 (0.50, 1.16) | National Cancer Center | 2021 [32] |
| Prudent | T3 vs. T1 (reference) | 0.58 (0.41, 0.84) | ||||||
| Index-based: hydrophilic ORAC | Case-control, 2011-2014 | 415/830, mean age: 53.7, men: 65.1 | 106-item FFQ, amount | T3 vs. T1 (reference) | OR | 0.57 (0.39, 0.82) | National Cancer Center | 2020 [33] |
| Lipophilic ORAC | T3 vs. T1 (reference) | 0.66 (0.45, 0.95) | ||||||
| Total phenolics | 0.57 (0.39, 0.83) | |||||||
| Index-based: DII | Case-control, 2011-2014 | 388/776, mean age: 53.3, men: 64.2 | 106-item FFQ, amount | T3 vs. T1 (reference) | OR | 1.63 (1.15, 2.29) | National Cancer Center | 2017 [34] |
| Glycemic load (1 study) | ||||||||
| Glycemic index | Case-control, 2002-2006 | 307/307, mean age: 56.6, men: 67.1 | 102, 115-item FFQ, amount | T3 vs. T1 (reference) | OR | 1.88 (1.18, 2.97) | Hanyang and Chungnam National University Hospital | 2022 [35] |
| Glycemic load | T3 vs. T1 (reference) | 2.51 (1.53, 4.12) | ||||||
| Saturated fat (1 study) | ||||||||
| Saturated fat | Case-control, 1997-1998 | 136/136, mean age: 57.2, men: 68.4 | 109-item FFQ, amount | Q4 vs. Q1 (reference) | OR | 0.75 (0.37, 1.53) | Hanyang and Hallym University Hospital | 2005 [12] |
| Dietary retinol (1 study) | ||||||||
| Dietary retinol | Case-control, 1997-1998 | 136/136, mean age: 57.2, men: 68.4 | 109-item FFQ, amount | Q4 vs. Q1 (reference) | OR | 0.57 (0.26, 1.23) | Hanyang and Hallym University Hospital | 2005 [12] |
| Dietary factors | Study design, enrollment year, follow-up duration (yr) | Sample size (cases/controls, non-cases), age (yr), % of men | Diet assessment, amount or frequency |
Risk estimate |
Sources | Year [Ref] | ||
|---|---|---|---|---|---|---|---|---|
| Category | Type | Effect (95% CI) | ||||||
| Whole grains, fruits, and vegetables | ||||||||
| Dietary fiber (2 studies) | ||||||||
| Dietary fiber | Case-control, 2010-2011 | 150/116, most frequent age range: 60-69, men: 62.0 | 102-item FFQ, amount | T3 vs. T1 (reference) | OR | 0.22 (0.08, 0.56) | Gangnam Severance Hospital | 2015 [36] |
| Dietary fiber | Case-control | 136/134, mean age: 53.3, men: 62.5 | 93-item FFQ, amount | T3 vs. T1 (reference) | OR | 0.20 (0.08, 0.51) | Three university-affiliated hospitals in Seoul (not specified) | 2005 [37] |
| Fruits and vegetables (6 studies) | ||||||||
| Total fruit and vegetables | Case-control, 2007-2014 | 923/1,846, mean age: 56.3, men: 67.7 | 106-item FFQ, amount | T3 vs. T1 (reference) | OR | 0.60 (0.45, 0.79) | National Cancer Center | 2017 [38] |
| Total fruit | 0.77 (0.58, 1.02) | |||||||
| Total vegetables | 0.48 (0.36, 0.64) | |||||||
| Fruits | Case-control, 2010-2011 | 150/116, most frequent age range: 60-69, men: 62.0 | 102-item FFQ, amount | T3 vs. T1(reference) | OR | 0.62 (0.27, 1.42) | Gangnam Severance Hospital | 2015 [36] |
| Vegetables | 0.54 (0.23, 1.28) | |||||||
| Fruits and vegetables | Cohort, 2004-2008, median follow-up: 7.0 | 53/7,637, mean age: 48.4, men: 54.7 | 3-day DR, amount | ≥600 vs. <600 g/day (reference) | HR | 0.85 (0.38, 1.92) | National Cancer Center | 2014 [13] |
| Fruits | Case-control | 136/134, mean age: 53.3, men: 62.5 | 93-item FFQ, amount | T3 vs. T1 (reference) | OR | 0.38 (0.20, 0.74) | Three university-affiliated hospitals in Seoul (not specified) | 2005 [37] |
| Vegetables | 0.30 (0.15, 0.62) | |||||||
| Fruits 1 | Case-control, 1994-1999 | (Men) 86/899, mean age: 46.3 | 51-item FFQ, amount | Q4 vs. Q1 (reference) | OR | 0.53 (0.22, 1.27) | Our Lady of Mercy Hospital (Catholic University) | 2005 [39] |
| Fruits 2 | 0.36 (0.16, 0.84) | |||||||
| Green/yellow vegetables 1 (fresh) | 0.97 (0.40, 2.35) | |||||||
| Green/yellow vegetables 2 (fresh) | 1.33 (0.39, 4.52) | |||||||
| Green/yellow vegetables 1 (boiling) | 0.75 (0.33, 1.71) | |||||||
| Green/yellow vegetables 2 (boiling) | 0.92 (0.38, 2.23) | |||||||
| Light color vegetables 1 (fresh) | 0.64 (0.19, 2.10) | |||||||
| Light color vegetables 2 (fresh) | 0.65 (0.19, 2.16) | |||||||
| Light color vegetables 1 (boiling) | 0.84 (0.33, 2.18) | |||||||
| Light color vegetables 2 (boiling) | 0.45 (0.15, 1.39) | |||||||
| Fruits 1 | Case-control, 1994-1999 | (Women) 76/1,677, mean age: 47.2 | 51-item FFQ, amount | Q4 vs. Q1 (reference) | OR | 1.13 (0.49, 2.61) | Our Lady of Mercy Hospital (Catholic University) | 2005 [39] |
| Fruits 2 | 1.14 (0.54, 2.40) | |||||||
| Green/yellow vegetables 1 (fresh) | 0.45 (0.15, 1.36) | |||||||
| Green/yellow vegetables 2 (fresh) | 0.89 (0.31, 2.57) | |||||||
| Green/yellow vegetables 1 (boiling) | 0.80 (0.30, 2.11) | |||||||
| Green/yellow vegetables 2 (boiling) | 1.17 (0.49, 2.81) | |||||||
| Light color vegetables 1 (fresh) | 0.52 (0.11, 2.35) | |||||||
| Light color vegetables 2 (fresh) | 0.97 (0.28, 3.35) | |||||||
| Light color vegetables 1 (boiling) | 0.46 (0.18, 1.16) | |||||||
| Light color vegetables 2 (boiling) | 0.71 (0.27, 1.83) | |||||||
| Vegetables | Case-control | 125/247, mean age: 56.5, men: 63.0 | Not specified, frequency | High vs. low (reference) | OR | 0.80 (0.49, 1.31) | Ilsan-Paik Hospital | 2003 [40] |
| Dietary carotenoids (3 studies) | ||||||||
| Dietary lutein/zeaxanthin | Case-control, 2007-2014 | 923/1,846, mean age: 56.3, men: 67.7 | 106-item FFQ, amount | Q4 vs. Q1(reference) | OR | 0.25 (0.18, 0.36) | National Cancer Center | 2019 [41] |
| Dietary β-carotene | Case-control, 2010-2011 | 150/116, most frequent age range: 60-69, men: 62.0 | 102-item FFQ, amount | T3 vs. T1 (reference) | OR | 0.56 (0.17, 1.87) | Gangnam Severance Hospital | 2015 [36] |
| Dietary carotene | Case-control | 136/134, mean age: 53.3, men: 62.5 | 93-item FFQ, amount | T3 vs. T1 (reference) | OR | 0.12 (0.06, 0.28) | Three university-affiliated hospitals in Seoul (not specified) | 2005 [37] |
| Dietary vitamin C (2 studies) | ||||||||
| Dietary vitamin C | Case-control, 2010-2011 | 150/116, most frequent age range: 60-69, men: 62.0 | 102-item FFQ, amount | T3 vs. T1 (reference) | OR | 0.38 (0.14, 1.05) | Gangnam Severance Hospital | 2015 [36] |
| Dietary vitamin C | Case-control | 136/134, mean age: 53.3, men: 62.5 | 93-item FFQ, amount | T3 vs. T1 ((reference) | OR | 0.18 (0.08, 0.40) | Three university-affiliated hospitals in Seoul (not specified) | 2005 [37] |
| Dietary Isoflavone (1 study) | ||||||||
| Dietary isoflavone | Case-control, 2007-2014 | 923/1,846, mean age: 56.3, men: 67.7 | 106-item FFQ, amount | Q4 vs. Q1 (reference) | OR | 0.61 (0.46, 0.81) | National Cancer Center | 2017 [42] |
| Meat, fish, and dairy products | ||||||||
| Meat (8 studies) | ||||||||
| Meat | Cohort, 1996-1997, follow-up: 6.0-7.0 | 6444/2,241,685, most frequent age range: 40-49, men: 36.8 | A single question, frequency | ≥4 vs. ≤1/wk (reference) | HR | 1.23 (1.13, 1.35) | Korean Health Insurance Corporation | 2011 [43] |
| Meat | Case-control, 2003-2005 | 80/75, mean age: 57.1, men: 52.0 | A single question, frequency | ≥3/wk vs. none (reference) | OR | 1.7 (0.70, 4.20) | Ewha Womans University Hospital | 2006 [44] |
| Meat | Case-control | 125/247, mean age: 56.5, men: 63.0 | Not specified, frequency | >2 vs. <2/wk (reference) | OR | 1.72 (1.12, 2.76) | Ilsan-Paik Hospital | 2003 [40] |
| Red meat | Case-control, 2007-2014 | 703/1,406, mean age: 56.1, men: 68.3 | 106-item FFQ, amount | ≥100 vs. <100 g/day (reference) | OR | 0.66 (0.47, 0.92) | National Cancer Center | 2019 [45] |
| Processed meat | ≥50 vs. <50 g/day (reference) | 0.78 (0.16, 3.93) | ||||||
| Red meat | Case-control, 1995-2004 | 971/658, mean age: 58.2, men: 56.2 | 94-item FFQ, frequency | ≥5 vs. <1/wk (reference) | OR | 1.29 (0.83, 2.01) | Three university-affiliated hospitals in Seoul (not specified) | 2019 [46] |
| Red meat | Case-control, 2010-2011 | 150/116, most frequent age range: 60-69, men: 62.0 | 102-item FFQ, amount | T3 vs. T1 (reference) | OR | 7.33 (2.98, 18.06) | Gangnam Severance Hospital | 2015 [36] |
| Red meat | Cohort, 2004-2008, median follow-up: 7.0 | 53/7,637, mean age: 48.4, men: 54.7 | 3-day DR, amount | ≥600 vs. <600 g/day (reference) | HR | 1.31 (0.60, 2.61) | National Cancer Center | 2014 [13] |
| Beef | Case-control | 136/134, mean age: 53.3, men: 62.5 | 93-item FFQ, amount | T3 vs. T1 (reference) T3 vs. T1 (reference) | OR | 0.62 (0.30, 1.28) | Three university-affiliated hospitals in Seoul (not specified) | 2005 [37] |
| Pork | 1.70 (0.80, 3.58) | |||||||
| Fish (2 studies) | ||||||||
| Fish | Case-control, 2010-2011 | 150/116, most frequent age range: 60-69, men: 62.0 | 102-item FFQ, amount | T3 vs. T1 (reference) | OR | 1.05 (0.45, 2.40) | Gangnam Severance Hospital | 2015 [36] |
| Fish | Case-control | 136/134, mean age: 53.3, men: 62.5 | 93-item FFQ, amount | T3 vs. T1(reference) | OR | 2.01 (0.97, 4.18) | Three university-affiliated hospitals in Seoul (not specified) | 2005 [37] |
| Anchovy | 0.35 (0.17, 0.74) | |||||||
| Dairy products (3 studies) | ||||||||
| Dairy | Case-control, 2007-2014 | 703/1,406, mean age: 56.1, men: 68.3 | 106-item FFQ, amount | ≥400 vs. <400 g/day (reference) | OR | 2.23 (1.53, 3.25) | National Cancer Center | 2019 [45] |
| Milk and dairy product | Case-control, 2010-2011 | 150/116, most frequent age range: 60-69, men: 62.0 | 102-item FFQ, amount | T3 vs. T1 (reference) OR 2.42 (1.10, 5.31) | Gangnam Severance Hospital | 2015 [36] | ||
| Milk | Case-control | 136/134, mean age: 53.3, men: 62.5 | 93-item FFQ, amount | T3 vs. T1 (reference) | 0.33 (0.18, 0.64) | Three university-affiliated hospitals in Seoul (not specified) | 2005 [37] | |
| Dietary iron (1 study) | ||||||||
| Dietary iron | Case-control | 136/134, mean age: 53.3, men: 62.5 | 93-item FFQ, amount | T3 vs. T1 (reference) | OR | 0.49 (0.18, 1.30) | Three university-affiliated hospitals in Seoul (not specified) | 2005 [37] |
| Dietary calcium (3 studies) | ||||||||
| Dietary calcium | Cohort, 2004-2013 mean follow-up: 5.4 | 635/118,866, mean age: 52.7, men: 34.3 | 106-item FFQ, amount | Per 200 g/day | HR | 0.93 (0.86, 1.01) | KoGES-HEXA | 2021 [47] |
| Dietary calcium | Case-control, 2007-2014 | (Men) 624/1,872, most frequent age range: 50-59 | 106-item FFQ, amount | Q4 vs. Q1 (reference) | OR | 0.16 (0.11, 0.24) | National Cancer Center | 2015 [48] |
| Dietary calcium | Case-control, 2007-2014 | (Women) 298/894, most frequent age range: 50-59 | 106-item FFQ, amount | Q4 vs. Q1 (reference) | OR | 0.16 (0.09, 0.29) | National Cancer Center | 2015 [48] |
| Dietary calcium | Case-control | 136/134, mean age: 53.3, men: 62.5 | 93-item FFQ, amount | T3 vs. T1 (reference) | OR | 0.18 (0.07, 0.42) | Three university-affiliated hospitals in Seoul (not specified) | 2005 [37] |
| Preservation and processing of foods | ||||||||
| Kimchi (2 studies) | ||||||||
| Kimchi | Case-control | 136/134, mean age: 53.3, men: 62.5 | 93-item FFQ, amount | T3 vs. T1 (reference) | OR | 0.32 (0.15, 0.65) | Three university-affiliated hospitals in Seoul (not specified) | 2005 [37] |
| Kimchi | Case-control, 1994-1999 | (Men) 86/899, mean age: 46.3 | 51-item FFQ, amount | Q4 vs. Q1 (reference) | OR | 1.31 (0.72, 2.38) | Our Lady of Mercy Hospital (Catholic University) | 2005 [39] |
| Kimchi | Case-control, 1994-1999 | (Women) 76/1,677, mean age: 47.2 | 51-item FFQ, amount | Q4 vs. Q1 (reference) | OR | 0.99 (0.59, 1.68) | Our Lady of Mercy Hospital (Catholic University) | 2005 [39] |
| Fermented soy products (1 study) | ||||||||
| Fermented soy paste | Case-control, 2007-2014 | (Men) 624/1,872, most frequent age range: 50-59 | 106-item FFQ, amount | Q4 vs. Q1 (reference) | OR | 1.82 (1.35, 2.46) | National Cancer Center | 2015 [49] |
| (Women) 298/894, most frequent age range: 50-59 | 106-item FFQ, amount | Q4 vs. Q1 (reference) | OR | 1.22 (0.77, 1.91) | National Cancer Center | 2015 [49] | ||
| Sodium (2 studies) | ||||||||
| Sodium | Case-control, 2010-2011 | 150/116, most frequent age range: 60-69, men: 62.0 | 102-item FFQ, amount | T3 vs. T1 (reference) | OR | 0.95 (0.39, 2.32) | Gangnam Severance Hospital | 2015 [36] |
| Sodium | Cohort, 2004-2008, median follow-up: 7.0 | 53/7,637, mean age: 48.4, men: 54.7 | 3-day DR, amount | ≥4,000 vs. <4,000 mg/day (reference) | HR | 1.52 (0.75, 3.08) | National Cancer Center | 2014 [13] |
| Non-alcoholic drinks | ||||||||
| Coffee (2 studies) | ||||||||
| Coffee | Case-control, 2007-2014 | 923/1,846, mean age: 56.3, men: 67.7 | 106-item FFQ, frequency | ≥3 cups/day vs. none (reference) | OR | 0.22 (0.14, 0.33) | National Cancer Center | 2021 [50] |
| Coffee | Cross-sectional, 2004-2016 | 521/161,699, mean age: 53.2, men: 34.3 | 106-item FFQ, frequency | >60 cups/mo vs. no drink (reference) | OR | 0.53 (0.39, 0.72) | KoGES-HEXA | 2021 [31] |
| Tea (1 study) | ||||||||
| Green tea | Case-control, 2007-2014 | 922/1,820, mean age: 56.3, men: 67.8 | 106-item FFQ, amount | T3 vs. T1 (reference) | OR | 0.59 (0.46, 0.76) | National Cancer Center | 2019 [51] |
| Other dietary exposures | ||||||||
| Dietary pattern (5 studies) | ||||||||
| Index-based: DIS | Case-control, 2007-2014 | 919/1,846, mean age: 56.3, men: 67.7 | 106-item FFQ, amount | T3 vs. T1 (reference) | OR | 3.00 (2.19, 4.10) | National Cancer Center | 2022 [52] |
| Index-based: EDIH | Case-control, 2007-2014 | 923/1,846, mean age: 56.3, men: 67.7 | 106-item FFQ, amount | Q4 vs. Q1 (reference) | OR | 1.14 (0.81, 1.60) | National Cancer Center | 2022 [53] |
| EDIR | 3.32 (2.32, 4.74) | |||||||
| RRR: CRP-related pattern | Case-control, 2007-2014 | 695/1,846, mean age: 56.2, men: 67.8 | 106-item FFQ, amount | Q4 vs. Q1 (reference) | OR | 9.98 (6.81, 14.62) | National Cancer Center | 2018 [54] |
| Factor analysis: traditional diet | Case-control, 2007-2014 | 923/1,846, mean age: 56.3, men: 67.7 | 106-item FFQ, amount | T3 vs. T1 (reference) | OR | 0.35 (0.27, 0.46) | National Cancer Center | 2016 [55] |
| Westernized diet | T3 vs. T1 (reference) | 2.35 (1.78, 3.09) | ||||||
| Prudent diet | T3 vs. T1 (reference) | 0.37 (0.28, 0.48) | ||||||
| Index-based: DII | Case-control, 2007-2014 | 923/1,846, mean age: 56.3, men: 67.7 | 106-item FFQ, amount | T3 vs. T1 (reference) | OR | 2.16 (1.71, 2.73) | National Cancer Center | 2016 [56] |
| Glycemic load (1 study) | ||||||||
| Glycemic index | Case-control, 2007-2014 | 695/1,401, mean age: 56.1, men: 68.3 | 106-item FFQ, amount | T3 vs. T1 (reference) | OR | 5.44 (3.85, 7.68) | National Cancer Center | 2022 [57] |
| Glycemic load | T3 vs. T1 (reference) | 4.43 (3.18, 6.15) | ||||||
| Saturated fat (2 studies) | ||||||||
| Saturated fatty acids | Case-control, 2010-2011 | 150/116, most frequent age range: 60-69, men: 62.0 | 102-item FFQ, amount | T3 vs. T1 (reference) | OR | 2.96 (1.24, 7.04) | Gangnam Severance Hospital | 2015 [36] |
| Saturated fatty acids | Case-control | 136/134, mean age: 53.3, men: 62.5 | 93-item FFQ, amount | T3 vs. T1 (reference) | OR | 0.46 (0.21, 0.99) | Three university-affiliated hospitals in Seoul (not specified) | 2005 [37] |
| Dietary retinol (1 study) | ||||||||
| Dietary retinol | Case-control | 136/134, mean age: 53.3, men: 62.5 | 93-item FFQ, amount | T3 vs. T1 (reference) | OR | 0.65 (0.31, 1.35) | Three university-affiliated hospitals in Seoul (not specified) | 2005 [37] |
| Dietary vitamin D (1 study) | ||||||||
| Dietary vitamin D | Case-control, 2010-2011 | 150/116, most frequent age range: 60-69, men: 62.0 | 102-item FFQ, amount | T3 vs. T1 (reference) | OR | 0.79 (0.37, 1.67) | Gangnam Severance Hospital | 2015 [36] |
OR, odds ratio; RR, relative risk; HR, hazard ratio; CI, confidence interval; Ref, reference number; FFQ, food frequency questionnaire; DR, dietary record; DIS, dietary inflammation score; EDIH, empirical dietary index for hyperinsulinemia; EDIR, empirical dietary index for insulin resistance; RRR, reduced rank regression; DII, dietary inflammatory index; KoGES-HEXA, Korean Genome and Epidemiology Study-Health Examinee.
| Dietary factors | Study design, enrollment year, follow-up duration (yr) | Sample size (cases/controls, non-cases), age (yr), % of women | Diet assessment, amount or frequency |
Risk estimate |
Sources | Year [Ref] | ||
|---|---|---|---|---|---|---|---|---|
| Category | Type | Effect (95% CI) | ||||||
| Whole grains, fruits, and vegetables | ||||||||
| Dietary fiber (2 studies) | ||||||||
| Dietary fiber | Case-control, 2004-2005 | 103/159, mean age: 50.1, women: 100 | 74-item FFQ, amount | Q4 vs. Q1 (reference) | OR | 0.37 (0.14, 0.99) | Daegu-area hospital for cases and community controls | 2008 [58] |
| Dietary fiber | Case-control, 1998-1999 | 108/121, most frequent age range: 40-49, women: 100 | 98-item FFQ, amount | Q4 vs. Q1 (reference) | OR | 0.61 (0.31, 2.06) | Hanyang and Soonchunhyang University Hospitals | 2000 [59] |
| Fruits and vegetables (5 studies) | ||||||||
| Fruits | Cohort, 2002-2007, mean follow-up: 9.5 | 72/4,974, most frequent age range: 40-49, women: 100 | 16-item brief FFQ, frequency | ≥1/day vs. ≤4-6/wk (reference) | HR | 1.22 (0.76, 1.97) | National Cancer Center | 2017 [60] |
| Light-colored vegetables | ≥4-6 vs. ≤2-3/wk (reference) | 0.87 (0.54, 1.38) | ||||||
| Green-yellow vegetables | ≥1/day vs. ≤4-6/wk (reference) | 1.46 (0.91, 2.33) | ||||||
| Total fruit and vegetables | Case-control, 2007-2008 | 358/360, mean age: 48.1, women: 100 | 103-item FFQ, amount | Q4 vs. Q1 (reference) | OR | 0.34 (0.19, 0.62) | National Cancer Center | 2010 [61] |
| Fruits | Q4 vs. Q1 (reference) | 0.75 (0.44, 1.28) | ||||||
| Total vegetables | Q4 vs. Q1 (reference) | 0.22 (0.12, 0.41) | ||||||
| Non-pickled vegetables | Q4 vs. Q1 (reference) | 0.09 (0.05, 0.18) | ||||||
| Total fruit | Case-control, 1999-2003 | 359/708, mean age: 49.1, women: 100 | 98-item FFQ, amount | Q4 vs. Q1 (reference) | OR | 0.79 (0.52, 1.32) | Hanyang and Soonchunhyang University Hospitals | 2007 [62] |
| Citrus fruit | Q4 vs. Q1 (reference) | 0.74 (0.40, 1.28) | ||||||
| Total vegetables | Q4 vs. Q1 (reference) | 0.76 (0.46, 1.23) | ||||||
| Fruits | Case-control, 2004-2005 | 103/159, mean age: 50.1, women: 100 | 22-item FFQ, frequency | 1/day vs. ≤1/wk (reference) | OR | 0.37 (0.15, 0.90) | Daegu-area hospital for cases and community controls | 2007 [63] |
| Green-yellow color vegetables | 1/day vs. ≤1/wk (reference) | 0.83 (0.26, 2.68) | ||||||
| Light color vegetables | 1/day vs. ≤1/wk (reference) | 0.58 (0.22, 1.53) | ||||||
| Fruits | Case-control, 1995-2002 | 819/713, mean age: 47.4, women: 100 | FFQ, frequency | Everyday vs. <1/day (reference) | OR | 0.70 (0.60, 0.90) | Seoul National University Hospital, Asan Medical Center, and Seoul Metropolitan Government Seoul National University Boramae Medical Center | 2003 [64] |
| Green vegetables | Everyday vs. <1/day (reference) | 0.60 (0.40, 1.00) | ||||||
| White vegetables | Everyday vs. <1/day (reference) | 1.10 (0.80, 1.50) | ||||||
| Dietary carotenoids (4 studies) | ||||||||
| Dietary β-carotene | Case-control, 2001-2003 | 512/512, mean age: 48.8, women: 100 | 56-item FFQ, amount | Q4 vs. Q1 (reference) | OR | 0.80 (0.53, 1.20) | Seoul National University Hospital, Asan Medical Center, and Ewha Womans University Hospital | 2012 [65] |
| Dietary β-carotene | Case-control, 2004-2006 | 362/362, mean age: 46.1, women: 100 | 121-item FFQ, amount | Per 500 ug/day | OR | 1.01 (0.98, 1.05) | Samsung Medical Center | 2010 [66] |
| Dietary β-carotene | Case-control, 2004-2005 | 103/159, mean age: 50.1, women: 100 | 74-item FFQ, amount | Q4 vs. Q1 (reference) | OR | 0.80 (0.33. 1.95) | Daegu-area hospital for cases and community controls | 2008 [58] |
| Dietary β-carotene | Case-control, 1999-2000 | 224/250, most frequent age range: 40-59, women: 100 | 98-item FFQ, amount | Q4 vs. Q1 (reference) | OR | 0.42 (0.25, 0.89) | Hanyang and Soonchunhyang University Hospitals | 2003 [67] |
| Dietary vitamin C (5 studies) | ||||||||
| Dietary vitamin C | Cohort, 2004-2013, mean follow-up: 4.9 | 232/40,200, most frequent age range: 40-59, women: 100 | 103-item FFQ, amount | >100 vs. ≤100 mg/day (reference) | HR | 0.95 (0.71, 1.26) | KoGES-HEXA | 2022 [68] |
| Dietary vitamin C | Case-control, 2001-2003 | 512/512, mean age: 48.8, women: 100 | 56-item FFQ, amount | Q4 vs. Q1 (reference) | OR | 1.07 (0.72, 1.60) | Seoul National University Hospital, Asan Medical Center, and Ewha Womans University Hospital | 2012 [65] |
| Dietary vitamin C | Case-control, 2004-2006 | 362/362, mean age: 46.1, women: 100 | 121-item FFQ, amount | Per 10 mg/day | OR | 1.01 (0.99, 1.04) | Samsung Medical Center | 2010 [66] |
| Dietary vitamin C | Case-control, 2004-2005 | 103/159, mean age: 50, women: 100 | 74-item FFQ, amount | Q4 vs. Q1 (reference) | OR | 0.76 (0.30, 1.93) | Daegu-area hospital for cases and community controls | 2008 [58] |
| Dietary vitamin C | Case-control, 1999-2000 | 224/250, most frequent age range: 40-59, women: 100 | 98-item FFQ, amount | Q4 vs. Q1(reference) | OR | 0.37 (0.19, 0.84) | Hanyang and Soonchunhyang University Hospitals | 2003 [67] |
| Dietary isoflavone (1 study) | ||||||||
| Dietary isoflavone | Case-control, 2007-2008 | 358/360, mean age: 48.1, women: 100 | 103-item FFQ, amount | Q4 vs. Q1 (reference) | OR | 0.81 (0.48, 1.38) | National Cancer Center | 2010 [69] |
| Meat, fish, and dairy products | ||||||||
| Meat (4 studies) | ||||||||
| Low fat meat | Case-control, 2004-2005 | 103/159, mean age: 50.1, women: 100 | 22-item FFQ, frequency | 2-3 vs. ≤1/wk (reference) | OR | 0.64 (0.38, 1.09) | Daegu-area hospital for cases and community controls | 2007 [63] |
| High fat meat | 2-3 vs. ≤1/wk (reference) | 0.79 (0.40, 1.53) | ||||||
| Meat | Case-control, 1995-2002 | 819/713, mean age: 47.4, women: 100 | FFQ, frequency | ≥1 vs. <1/wk (reference) | OR | 1.50 (1.20, 1.90) | Seoul National University Hospital, Asan Medical Center, and Seoul Metropolitan Government Seoul National University Boramae Medical Center | 2003 [64] |
| Grilled meat | Cohort, 2002-2007, mean follow-up: 9.5 | 72/4,974, most frequent age range: 40-49, women: 100 | 16-item brief FFQ, frequency | ≥2-3 vs. ≤1/mo (reference) | HR | 1.77 (1.09, 2.85) | National Cancer Center | 2017 [60] |
| Grill beef rib | Case-control, 1998-1999 | 108/121, most frequent age range: 40-49, women: 100 | 98-item FFQ, amount | Q4 vs. Q1 (reference) | OR | 0.96 (0.63, 2.02) | Hanyang and Soonchunhyang University Hospitals | 2000 [59] |
| Bulgogi | 1.12 (0.73, 2.38) | |||||||
| Grilled pork | 1.21 (0.89, 2.21) | |||||||
| Grilled pork belly | 1.11 (0.81, 2.15) | |||||||
| Pork cutlet | 0.91 (0.78, 2.61) | |||||||
| Grilled ham | 0.87 (0.71, 2.18) | |||||||
| Fish (5 studies) | ||||||||
| Bony fish | Cohort, 2002-2007, mean follow-up: 9.5 | 72/4,974, most frequent age range: 40-49, women: 100 | 16-item brief FFQ, frequency | ≥2-3 vs. ≤1/wk (reference) | HR | 1.14 (0.71, 1.83) | National Cancer Center | 2017 [60] |
| Total fish | Case-control, 2007-2008 | 358/360, mean age: 48.1, women: 100 | 103-item FFQ, amount | Q4 vs. Q1 (reference) | OR | 0.55 (0.32, 0.96) | National Cancer Center | 2009 [70] |
| Lean fish | 1.21 (0.72, 2.04) | |||||||
| Fatty fish | 0.23 (0.13, 0.42) | |||||||
| White flesh fish | Case-control, 2004-2005 | 103/159, mean age: 50.1, women: 100 | 22-item FFQ, frequency | 1/day vs. ≤1/wk (reference) | OR | 1.64 (0.52–5.16) | Daegu-area hospital for cases and community controls | 2007 [63] |
| Blue flesh fish | ≥2-3 vs. ≤1/wk (reference) | 1.32 (0.74, 2.36) | ||||||
| Fish | Case-control, 1995-2002 | 819/713, mean age: 47.4, women: 100 | FFQ, frequency | ≥1 vs. <1/wk (reference) | OR | 1.50 (1.20, 1.90) | Seoul National University Hospital, Asan Medical Center, and Seoul Metropolitan Government Seoul National University Boramae Medical Center | 2003 [64] |
| Fish meat | Case-control, 1998-1999 | 108/121, most frequent age range: 40-49, women: 100 | 98-item FFQ, amount | Q4 vs. Q1 (reference) | OR | 0.95 (0.87, 2.44) | Hanyang and Soonchunhyang University Hospitals | 2000 [59] |
| Raw croaker | 0.51 (0.35, 1.19) | |||||||
| Grilled yellow croaker | 0.89 (0.21, 1.93) | |||||||
| Tuna canned | 0.85 (0.39, 1.39) | |||||||
| Dairy products (5 studies) | ||||||||
| Milk | Cohort, 2004-2013, mean follow-up: 6.3 | 359/77,961, mean age: 52.3, women: 100 | 106-item FFQ, frequency | ≥1/day vs. <1/wk (reference) | HR | 0.78 (0.59, 1.04) | KoGES-HEXA Gem | 2020 [71] |
| Dairy food | Cohort, 2002-2007, mean follow-up: 9.5 | 72/4,974, most frequent age range: 40-49, women: 100 | 16-item brief FFQ, frequency | ≥4-6 vs. ≤2-3/wk (reference) | HR | 1.32 (0.83, 2.11) | National Cancer Center | 2017 [60] |
| Milk, yogurt | Case-control, 2004-2005 | 103/159, mean age: 50.1, women: 100 | 22-item FFQ, frequency | 1/day vs. ≤1/wk (reference) | OR | 1.19 (0.52, 2.70) | Daegu-area hospital for cases and community controls | 2007 [63] |
| Milk | Case-control, 1995-2002 | 819/713, mean age: 47.4, women: 100 | FFQ, frequency | Everyday vs. <1/day (reference) | OR | 0.90 (0.80, 1.20) | Seoul University Hospital, Asan Medical Center, and Seoul Metropolitan Government Seoul National University Boramae Medical Center | 2003 [64] |
| Milk | Case-control, 1998-1999 | 108/121, most frequent age range: 40-49, women: 100 | 98-item FFQ, amount | Q4 vs. Q1 (reference) | OR | 0.51 (0.34, 2.20) | Hanyang and Soonchunhyang University Hospitals | 2000 [59] |
| Yogurt | 1.05 (0.39, 2.19) | |||||||
| Cheese | 0.51 (0.43, 2.23) | |||||||
| Dietary iron (3 studies) | ||||||||
| Dietary iron | Cohort, 2004-2013, mean follow-up: 4.9 | 232/40,200, most frequent age range: 40-59, women: 100 | 103-item FFQ, amount | >14 vs. ≤14 mg/day (reference) for 30-49 yr, >8 vs. ≤8 mg/day (reference) for 50-74 yr, and >7 vs. ≤7 mg/day (reference) for ≥75 yr | HR | 0.74 (0.52, 1.06) | KoGES-HEXA | 2022 [68] |
| Dietary iron | Case-control, 2004-2005 | 103/159, mean age: 50.1, women: 100 | 74-item FFQ, amount | Q4 vs. Q1(reference) | OR | 0.76 (0.27, 2.16) | Daegu-area hospital for cases and community controls | 2008 [58] |
| Dietary iron | Case-control, 1998-1999 | 108/121, most frequent age range: 40-49, women: 100 | 98-item FFQ, amount | Q4 vs. Q1 (reference) | OR | 0.71 (0.53, 1.72) | Hanyang and Soonchunhyang University Hospitals | 2000 [59] |
| Dietary calcium (3 studies) | ||||||||
| Dietary calcium | Cohort, 2004-2013, mean follow-up: 4.9 | 232/40,200, most frequent age range: 40-59, women: 100 | 103-item FFQ, amount | >700 vs. ≤700 mg/day (reference) for 30-49 yr, >800 vs. ≤800 mg/day (reference) for ≥50 yr | HR | 1.12 (0.72, 1.76) | KoGES-HEXA | 2022 [68] |
| Dietary calcium | Case-control, 2004-2005 | 103/159, mean age: 50.1, women: 100 | 74-item FFQ, amount | Q4 vs. Q1 (reference) | OR | 0.33 (0.13, 0.86) | Daegu-area hospital for cases and community controls | 2008 [58] |
| Dietary calcium | Case-control, 1998-1999 | 108/121, most frequent age range: 40-49, women: 100 | 98-item FFQ, amount | Q4 vs. Q1 (reference) | OR | 0.85 (0.27, 1.30) | Hanyang and Soonchunhyang University Hospitals | 2000 [59] |
| Preservation and processing of foods | ||||||||
| Pickled vegetables and Kimchi (2 studies) | ||||||||
| Pickled vegetables | Case-control, 2007-2008 | 358/360, mean age: 48.1, women: 100 | 103-item FFQ, amount | Q4 vs. Q1 (reference) | OR | 2.47 (1.45, 4.21) | National Cancer Center | 2010 [61] |
| Cabbage kimchi | Case-control, 1999-2003 | 359/708, mean age: 49.1, women: 100 | 98-item FFQ, amount | Q4 vs. Q1 (reference) | OR | 0.83 (0.57, 1.59) | Hanyang and Soonchunhyang University Hospitals | 2007 [62] |
| Radish kimchi | 0.77 (0.45, 1.27) | |||||||
| Salted vegetables and fish (1 study) | ||||||||
| Salted vegetables and seafood | Cohort, 2002-2007, mean follow-up: 9.5 | 72/4,974, most frequent age range: 40-49, women: 100 | 16-item brief FFQ, frequency | ≥2 vs. ≤1/day (reference) | HR | 0.98 (0.61, 1.58) | National Cancer Center | 2017 [60] |
| Fermented soy products (2 studies) | ||||||||
| Fermented soy paste | Case-control, 2007-2008 | 358/360, mean age: 48.1, women: 100 | 103-item FFQ, amount | Q4 vs. Q1 (reference) | OR | 0.31 (0.17, 0.56) | National Cancer Center Hanyang and | 2010 [69] |
| Soybean paste | Case-control, 1999-2003 | 359/708, mean age: 49.1, women: 100 | 98-item FFQ, amount | Q4 vs. Q1 (reference) | OR | 0.71 (0.54, 1.30) | Soonchunhyang University Hospitals | 2007 [62] |
| Sodium (1 study) | ||||||||
| Sodium | Case-control, 1998-1999 | 108/121, most frequent age range: 40-49, women: 100 | 98-item FFQ, amount | Q4 vs. Q1 (reference) | OR | 0.96 (0.57, 1.38) | Hanyang and Soonchunhyang University Hospitals | 2000 [59] |
| Non-alcoholic drinks | ||||||||
| Coffee (3 studies) | ||||||||
| Coffee | Cross-sectional, 2004-2016 | 1117/105,493, mean age: 53.2, women: 100 | 106-item FFQ, frequency | >60 cups/mo vs. no drink (reference) | OR | 0.56 (0.45, 0.70) | KoGES-HEXA | 2021 [31] |
| Coffee | Case-control, 2004-2005 | 103/159, mean age: 50.1, women: 100 | 22-item FFQ, frequency | 1/day vs. ≤1/wk (reference) | OR | 1.17 (0.61, 2.25) | Daegu-area hospital for cases and community controls | 2007 [63] |
| Coffee | Case-control, 1998-1999 | 108/121, most frequent age range: 40-49, women: 100 | 98-item FFQ, amount | Q4 vs. Q1 (reference) | OR | 0.53 (0.44, 1.23) | Hanyang and Soonchunhyang University Hospitals | 2000 [59] |
| Tea (2 studies) | ||||||||
| Green tea | Case-control, 2004-2005 | 103/159, mean age: 50.1, women: 100 | 22-item FFQ, frequency | 1/day vs. ≤1/wk (reference) | OR | 0.97 (0.49, 1.95) | Daegu-area hospital for cases and community controls | 2007 [63] |
| Green tea | Case-control, 1998-1999 | 108/121, most frequent age range: 40-49, women: 100 | 98-item FFQ, amount | Q4 vs. Q1 (reference) | OR | 0.58 (0.27, 1.08) | Hanyang and Soonchunhyang University Hospitals | 2000 [59] |
| Other dietary exposures | ||||||||
| Dietary pattern (4 studies) | ||||||||
| Factor analysis: meat diet | Cohort, 2004-2013, mean follow-up: 6.3 | 359/77,961, mean age: 52.3, women: 100 | 106-item FFQ, amount | Q4 vs. Q1 (reference) | HR | 1.05 (0.76, 1.47) | KoGES-HEXA Gem | 2020 [72] |
| White rice diet | Q4 vs. Q1 (reference) | 1.35 (1.00, 1.84) | ||||||
| Other diet | Q4 vs. Q1 (reference) | 1.30 (0.94, 1.80) | ||||||
| Index-based: DII | Case-control, 2007-2008 | 364/364, mean age: 47.8, women: 100 | 106-item FFQ, amount | T3 vs. T1 (reference) | OR | 3.68 (2.34, 5.80) | National Cancer Center | 2019 [73] |
| RRR: glycemic index-based pattern, Glycemic load-based pattern | Case-control, 2007-2008 | 357/357, mean age: 48.2, women: 100 | 103-item FFQ, amount | T3 vs. T1 (reference) | OR | 1.97 (1.14, 3.42) | National Cancer Center | 2013 [74] |
| T3 vs. T1 (reference) | 2.66 (1.57, 4.49) | |||||||
| Factor analysis: vegetables-seafood | Case-control, 2007-2008 | 357/357, mean age: 48.2, women: 100 | 103-item FFQ, amount | T3 vs. T1 (reference) | OR | 0.14 (0.08, 0.25) | National Cancer Center | 2010 [75] |
| Meat-Starch | T3 vs. T1 (reference) | 0.69 (0.40, 1.16) | ||||||
| Glycemic load (2 studies) | ||||||||
| Glycemic index | Case-control, 2007-2008 | 357/357, mean age: 48.2, women: 100 | 103-item FFQ, amount | T3 vs. T1 (reference) | OR | 2.50 (1.46, 4.31) | National Cancer Center | 2013 [74] |
| Glycemic load | T3 vs. T1 (reference) | 3.27 (1.94, 5.50) | ||||||
| Glycemic index | Case-control, 2004-2006 | 362/362, mean age: 46.1, women: 100 | 121-item FFQ, amount | Q5 vs. Q1 (reference) | OR | 0.44 (0.23, 0.85) | Samsung Medical Center | 2010 [76] |
| Glycemic load | Q5 vs. Q1 (reference) | 0.85 (0.48, 1.50) | ||||||
| Saturated fat (2 studies) | ||||||||
| Saturated fatty acids | Case-control, 2004-2005 | 103/159, mean age: 50.1, women: 100 | 74-item FFQ, amount | Q4 vs. Q1 (reference) | OR | 0.22 (0.09, 0.56) | Daegu-area hospital for cases and community controls | 2008 [58] |
| Saturated fatty acids | Case-control, 1999-2000 | 224/250, most frequent age range: 40-59, women: 100 | 98-item FFQ, amount | Q4 vs. Q1 (reference) | OR | 1.65 (0.92, 2.45) | Hanyang and Soonchunhyang University Hospitals | 2003 [67] |
| Dietary retinol (3 studies) | ||||||||
| Dietary retinol | Case-control, 2001-2003 | 512/512, mean age: 48.8, women: 100 | 56-item FFQ, amount | Q4 vs. Q1 (reference) | OR | 0.72 (0.45, 1.16) | Seoul National University Hospital, Asan Medical Center, and Ewha Womans University Hospital | 2012 [65] |
| Dietary retinol | Case-control, 2004-2005 | 103/159, mean age: 50.1, women: 100 | 74-item FFQ, amount | Q4 vs. Q1 (reference) | OR | 0.62 (0.23, 1.67) | Daegu-area hospital for cases and community controls | 2008 [58] |
| Dietary retinol | Case-control, 1999-2000 | 224/250, most frequent age range: 40-59, women: 100 | 98-item FFQ, amount | Q4 vs. Q1 (reference) | OR | 0.88 (0.26, 1.09) | Hanyang and Soonchunhyang University Hospitals | 2003 [67] |
| Dietary factors | Study design, enrollment year, follow-up duration (yr) | Sample size (cases/controls, non-cases), age (yr), % of men | Diet assessment, amount or frequency |
Risk estimate |
Sources | Year [Ref[ | ||
|---|---|---|---|---|---|---|---|---|
| Category | Type | Effect (95% CI) | ||||||
| Whole grains, fruits, and vegetables | ||||||||
| Dietary fiber (1 study) | ||||||||
| Dietary fiber | Case-control, 2007-2014 | 113/226, mean age: 53.7, men: 0.0 | 106-item FFQ, amount | Upper vs. lower median (reference) | OR | 1.18 (0.75, 1.87) | National Cancer Center | 2016 [77] |
| Fruits and vegetables (2 studies) | ||||||||
| Fruits and vegetables | Cohort, 2004-2008, median follow-up: 7.0 | 136/7,637, mean age: 48.4, men: 54.6 | 3-day DR, amount | ≥600 vs. <600 g/day (reference) | HR | 0.87 (0.54, 1.42) | National Cancer Center | 2014 [13] |
| Total fruit | Case-control, 2008-2010 | 111/111, mean age: 45.6, men: 0.0 | 121-item FFQ, amount | Q4 vs. Q1 (reference) | OR | 0.59 (0.23, 1.52) | Hanyang University Hospital | 2013 [78] |
| Total vegetables | Q4 vs. Q1 (reference) | 0.51 (0.15, 1.78) | ||||||
| Raw vegetables | Q4 vs. Q1 (reference) | 0.20 (0.07, 0.62) | ||||||
| Carotenoid (1 study) | ||||||||
| Dietary β-carotene | Case-control, 2007-2014 | 113/226, mean age: 53.7, men: 0.0 | 106-item FFQ, amount | Upper vs. lower median (reference) | OR | 1.22 (0.77, 1.93) | National Cancer Center | 2016 [77] |
| Dietary vitamin C (1 study) | ||||||||
| Dietary vitamin C | Case-control, 2007-2014 | 113/226, mean age: 53.7, men: 0.0 | 106-item FFQ, amount | Upper vs. lower median (reference) | OR | 1.17 (0.74, 1.85) | National Cancer Center | 2016 [77] |
| Meat, fish, and dairy products | ||||||||
| Red meat (1 study) | ||||||||
| Red meat | Cohort, 2004-2008, median follow-up: 7.0 | 136/7,637, mean age: 48.4, men: 54.6 | 3-day DR, amount | ≥43 vs. <43 g/day (reference) | HR | 0.91 (0.61, 1.36) | National Cancer Center | 2014 [13] |
| Dietary iron (1 study) | ||||||||
| Dietary iron | Case-control, 2007-2014 | 113/226, mean age: 53.7, men: 0.0 | 106-item FFQ, amount | Upper vs. lower median (reference) | OR | 1.00 (0.63, 1.57) | National Cancer Center | 2016 [77] |
| Dietary calcium (1 study) | ||||||||
| Dietary calcium | Case-control, 2007-2014 | 113/226, mean age: 53.7, men: 0.0 | 106-item FFQ, amount | Upper vs. lower median (reference) | OR | 0.55 (0.35, 0.89) | National Cancer Center | 2016 [77] |
| Preservation and processing of foods | ||||||||
| Sodium (1 study) | ||||||||
| Sodium | Cohort, 2004-2008, median follow-up: 7.0 | 136/7,637, mean age: 48.4, men: 54.6 | 3-day DR, amount | ≥4,000 vs. <4,000 mg/day (reference) | HR | 1.11 (0.72, 1.69) | National Cancer Center | 2014 [13] |
| Non-alcoholic drinks | ||||||||
| Coffee (1 study) | ||||||||
| Coffee | Cross-sectional, 2004-2016 | 1,410/160,810,mean age: 53.2, men: 34.3 | 106-item FFQ, frequency | >60 cups/mo vs. no drink (reference) | OR | 0.71 (0.59, 0.85) | KoGES-HEXA | 2021 [31] |
| Other dietary exposures | ||||||||
| Dietary pattern (1 study) | ||||||||
| Factor analysis: traditional balanced diet | Cross-sectional, 2004-2013 | 495/56,439, mean age: 53.6, men: 33.8 | 106-item FFQ, amount | ≥70th vs. <70th percentile (reference) | OR | 0.79 (0.60, 1.05) | KoGES-HEXA | 2021 [79] |
| Prudent diet | 1.45 (1.14, 1.83) | |||||||
| Noodle/meat diet | 0.67 (0.51, 0.89) | |||||||
| Rice-based diet | 0.84 (0.65, 1.08) | |||||||
| Dietary retinol (1 study) | ||||||||
| Dietary retinol | Case-control, 2007-2014 | 113/226, mean age: 53.7, men: 0.0 | 106-item FFQ, amount | Upper vs. lower median (reference) | OR | 0.95 (0.60, 1.52) | National Cancer Center | 2016 [77] |
| Dietary factors | Study design, enrollment year | Sample size (cases/controls, non-cases), age (yr) | Diet assessment, amount or frequency |
Risk estimate |
Sources | Year [Ref] | ||
|---|---|---|---|---|---|---|---|---|
| Category | Type | Effect (95% CI) | ||||||
| Whole grains, fruits, and vegetables | ||||||||
| Dietary fiber (1 study) | ||||||||
| Dietary fiber | Case-control, 2006-2010 | 229/729, mean age: 44.2 | 95-item FFQ, amount | Q5 vs. Q1 (reference) | OR | 0.62 (0.37, 1.02) | 6 university-affiliated hospitals in Korea (Korea, Yonsei, Chungnam, Gachon, Inha, and Ajou University) | 2019 [80] |
| Carotenoid (3 studies) | ||||||||
| Dietary β-carotene | Case-control, 2006-2010 | 229/729, mean age: 44.2 | 95-item FFQ, amount | Q5 vs. Q1 (reference) | OR | 0.66 (0.41, 1.06) | 6 university-affiliated hospitals in Korea (Korea, Yonsei, Chungnam, Gachon, Inha, and Ajou University) | 2019 [80] |
| Dietary vitamin C (2 studies) | ||||||||
| Dietary vitamin C | Case-control, 2006-2010 | 229/729, mean age: 44.2 | 95-item FFQ, amount | Q5 vs. Q1 (reference) | OR | 0.57 (0.35, 0.92) | 6 university-affiliated hospitals in Korea (Korea, Yonsei, Chungnam, Gachon, Inha, and Ajou University) | 2019 [80] |
| Non-alcoholic drinks | ||||||||
| Coffee (1 study) | ||||||||
| Coffee | Cross-sectional, 2004-2016 | 689/105,921, mean age: 53.2 | 106-item FFQ, frequency | >60 cups/mo vs. no drink (reference) | OR | 0.98 (0.75, 1.27) | KoGES-HEXA | 2021 [31] |
| Tea (1 study) | ||||||||
| Tea | Case-control, 2006-2010 | 229/729, mean age: 44.2 | 95-item FFQ, amount | Q5 vs. Q1 (reference) | OR | 1.33 (0.85, 2.06) | 6 university-affiliated hospitals in Korea (Korea, Yonsei, Chungnam, Gachon, Inha, and Ajou University) | 2019 [80] |
| Other dietary exposures | ||||||||
| Dietary pattern (1 study) | ||||||||
| Index-based: DII | Case-control, 2006-2010 | 229/729, mean age: 44.2 | 95-item FFQ, amount | Per 1 unit increase in DII | OR | 1.12 (1.00, 1.24) | 6 university-affiliated hospitals in Korea (Korea, Yonsei, Chungnam, Gachon, Inha, and Ajou University) | 2019 [80] |
| Glycemic load (1 study) | ||||||||
| Glycemic index | Case-control, since 2006 | 221/670, mean age: 45.2 | 95-item FFQ, amount | Q5 vs. Q1 (reference) | OR | 0.46 (0.17, 1.21) | 8 university-affiliated hospitals in Korea (not specified) | 2020 [81] |
| Glycemic load | Q5 vs. Q1 (reference) | 0.50 (0.19, 1.30) | ||||||
| Dietary retinol (2 studies) | ||||||||
| Dietary retinol | Case-control, 2006-2007 | 144/288, most frequent age range: 40-49 | 95-item FFQ, amount | Q4 vs. Q1 (reference) | OR | 0.81 (0.45, 1.46) | 6 university-affiliated hospitals in Korea (Korea, Yonsei, Chungnam, Gachon, Inha, and Ajou University) | 2010 [82] |
| Area of focus | Points |
|---|---|
| Study design | Longitudinal studies with sufficient statistical power are required to examine the temporal associations between diet and cancer risk |
| Cancer type | Further studies on anatomical sites with a substantial burden of disease that have been understudied in relation to dietary factors are suggested (e.g., lung, prostate, and liver) [2] |
| Confounder | Studies controlling for the major confounders with respect to specific cancer types should be considered |
| Attributable risk | To estimate the attributable risk of diet on cancer in Korean population, combining cohort studies that share dietary assessment methods and conducting pooled analyses are advised when examining diet-cancer associations to further estimate the cancer burden attributable to dietary factors |
| Life-course perspective | To consider the time-varying nature of nutrition, considering the role of diet during the early-life period, analyzing dietary pattern methods, and utilizing repeated measures of dietary assessment or recovery biomarkers of nutritional status are suggested [95] |
| Biological mechanism | To elucidate the biological mechanisms in diet-cancer research, further investigations of molecular subtypes of cancer and the interaction between diet and exposomes (e.g., environment, genomics, metabolomics, or gut microbiota profiles) are warranted [95] |
- 1. Sung H, Ferlay J, Siegel RL, Laversanne M, Soerjomataram I, Jemal A, et al. Global cancer statistics 2020: GLOBOCAN estimates of incidence and mortality worldwide for 36 cancers in 185 countries. CA Cancer J Clin 2021;71:209-249.ArticlePubMedPDF
- 2. Kang MJ, Won YJ, Lee JJ, Jung KW, Kim HJ, Kong HJ, et al. Cancer statistics in Korea: incidence, mortality, survival, and prevalence in 2019. Cancer Res Treat 2022;54:330-344.ArticlePubMedPMCPDF
- 3. Whiteman DC, Wilson LF. The fractions of cancer attributable to modifiable factors: a global review. Cancer Epidemiol 2016;44:203-221.ArticlePubMed
- 4. Aunan JR, Cho WC, Søreide K. The biology of aging and cancer: a brief overview of shared and divergent molecular hallmarks. Aging Dis 2017;8:628-642.ArticlePubMedPMC
- 5. International Agency for Research on Cancer. World cancer report: cancer research for cancer prevention. Lyon: World Health Organization; 2020. p 1-5.
- 6. Anand P, Kunnumakkara AB, Sundaram C, Harikumar KB, Tharakan ST, Lai OS, et al. Cancer is a preventable disease that requires major lifestyle changes. Pharm Res 2008;25:2097-2116.ArticlePubMedPMCPDF
- 7. Inoue M, Hirabayashi M, Abe SK, Katanoda K, Sawada N, Lin Y, et al. Burden of cancer attributable to modifiable factors in Japan in 2015. Glob Health Med 2022;4:26-36.ArticlePubMedPMC
- 8. World Cancer Research Fund International. Diet, nutrition, physical activity and cancer: a global perspective. [cited 2023 May 1]. Available from: https://www.wcrf.org/diet-activity-and-cancer/global-cancer-update-programme/resources-and-toolkits/.
- 9. Ubago-Guisado E, Rodríguez-Barranco M, Ching-López A, Petrova D, Molina-Montes E, Amiano P, et al. Evidence update on the relationship between diet and the most common cancers from the European Prospective Investigation into Cancer and Nutrition (EPIC) study: a systematic review. Nutrients 2021;13:3582.ArticlePubMedPMC
- 10. Aromataris E, Fernandez R, Godfrey CM, Holly C, Khalil H, Tungpunkom P. Summarizing systematic reviews: methodological development, conduct and reporting of an umbrella review approach. Int J Evid Based Healthc 2015;13:132-140.PubMed
- 11. Thi Tran T, Gunathilake M, Lee J, Choi IJ, Kim YI, Kim J. The association of dietary fibre intake and the IL13 rs20541 polymorphism with the risk of gastric cancer: a case-control study in Korea. Eur J Clin Nutr 2022;76:1031-1037.ArticlePubMedPDF
- 12. Kim HJ, Kim MK, Chang WK, Choi HS, Choi BY, Lee SS. Effect of nutrient intake and Helicobacter pylori infection on gastric cancer in Korea: a case-control study. Nutr Cancer 2005;52:138-146.ArticlePubMed
- 13. Wie GA, Cho YA, Kang HH, Ryu KA, Yoo MK, Kim YA, et al. Red meat consumption is associated with an increased overall cancer risk: a prospective cohort study in Korea. Br J Nutr 2014;112:238-247.ArticlePubMed
- 14. Ko KP, Park SK, Yang JJ, Ma SH, Gwack J, Shin A, et al. Intake of soy products and other foods and gastric cancer risk: a prospective study. J Epidemiol 2013;23:337-343.ArticlePubMedPMC
- 15. Hoang BV, Lee J, Choi IJ, Kim YW, Ryu KW, Kim J. Effect of dietary vitamin C on gastric cancer risk in the Korean population. World J Gastroenterol 2016;22:6257-6267.ArticlePubMedPMC
- 16. Nan HM, Park JW, Song YJ, Yun HY, Park JS, Hyun T, et al. Kimchi and soybean pastes are risk factors of gastric cancer. World J Gastroenterol 2005;11:3175-3181.ArticlePubMedPMC
- 17. Lee SA, Kang D, Shim KN, Choe JW, Hong WS, Choi H. Effect of diet and Helicobacter pylori infection to the risk of early gastric cancer. J Epidemiol 2003;13:162-168.ArticlePubMed
- 18. Kim HJ, Chang WK, Kim MK, Lee SS, Choi BY. Dietary factors and gastric cancer in Korea: a case-control study. Int J Cancer 2002;97:531-535.ArticlePubMed
- 19. Park JW, Song YJ, Yun HY, Kim H, Ahn YO, Kim SJ, et al. The risk of gastric cancer in Koreans according to smoking, drinking, diet, and the genetic polymorphisms of glutathione S-transferases and L-myc protooncogene. J Korean Cancer Assoc 2000;32:997-1006 (Korean).
- 20. Kim SA, Kwak JH, Eun CS, Han DS, Kim YS, Song KS, et al. Association of dietary antioxidant vitamin intake and gastric cancer risk according to smoking status and histological subtypes of gastric cancer: a case-control study in Korea. Nutr Cancer 2023;75:652-661.ArticlePubMed
- 21. Kim JH, Lee J, Choi IJ, Kim YI, Kwon O, Kim H, et al. Dietary carotenoids intake and the risk of gastric cancer: a case-control study in Korea. Nutrients 2018;10:1031.ArticlePubMedPMC
- 22. Kim DS, Lee MS, Kim YS, Kim DH, Bae JM, Shin MH, et al. Effect modification by vitamin C on the relation between gastric cancer and Helicobacter pylori. Eur J Epidemiol 2005;20:67-71.ArticlePubMedPDF
- 23. Yang S, Park Y, Lee J, Choi IJ, Kim YW, Ryu KW, et al. Effects of soy product intake and interleukin genetic polymorphisms on early gastric cancer risk in Korea: a case-control study. Cancer Res Treat 2017;49:1044-1056.ArticlePubMedPMCPDF
- 24. Kim J, Park S, Nam BH. Gastric cancer and salt preference: a population-based cohort study in Korea. Am J Clin Nutr 2010;91:1289-1293.ArticlePubMed
- 25. Lee SA, Kang D, Hong WS, Shim KN, Choe JW, Choi H. Dietary habit and Helicobacter pylori infection in early gastric cancer patient. Cancer Res Treat 2002;34:104-110.ArticlePubMed
- 26. Yun HY, Kim JK, Song YJ, Park JS, Lee CH, Nam HM, et al. Effect of the genetic polymorphism of N-acetyltransferase 2 and diet on the carcinogenesis of gastric cancer in Koreans. J Korean Surg Soc 2003;64:459-465 (Korean).
- 27. Tran TT, Gunathilake M, Lee J, Choi IJ, Kim YI, Kim J. The associations of dietary iron intake and the transferrin receptor (TFRC) rs9846149 polymorphism with the risk of gastric cancer: a case-control study conducted in Korea. Nutrients 2021;13:2600.ArticlePubMedPMC
- 28. Zhang YW, Eom SY, Kim YD, Song YJ, Yun HY, Park JS, et al. Effects of dietary factors and the NAT2 acetylator status on gastric cancer in Koreans. Int J Cancer 2009;125:139-145.ArticlePubMedPMC
- 29. Kwak JH, Eun CS, Han DS, Kim YS, Song KS, Choi BY, et al. Gastric cancer and the daily intake of the major dish groups contributing to sodium intake: a case-control study in Korea. Nutrients 2021;13:1365.ArticlePubMedPMC
- 30. Yoo JY, Cho HJ, Moon S, Choi J, Lee S, Ahn C, et al. Pickled vegetable and salted fish intake and the risk of gastric cancer: two prospective cohort studies and a meta-analysis. Cancers (Basel) 2020;12:996.ArticlePubMedPMC
- 31. Kim SY, Yoo DM, Min C, Choi HG. Association between coffee consumption/physical exercise and gastric, hepatic, colon, breast, uterine cervix, lung, thyroid, prostate, and bladder cancer. Nutrients 2021;13:3927.ArticlePubMedPMC
- 32. Kim JH, Lee J, Choi IJ, Kim YI, Kim J. Dietary patterns and gastric cancer risk in a Korean population: a case-control study. Eur J Nutr 2021;60:389-397.ArticlePubMedPDF
- 33. Kim J, Kim H, Lee J, Choi IJ, Kim YI, Kim J. Antioxidant-rich diet, GSTP1 rs1871042 polymorphism, and gastric cancer risk in a hospital-based case-control study. Front Oncol 2021;10:596355.ArticlePubMedPMC
- 34. Lee S, Lee J, Choi IJ, Kim YW, Ryu KW, Kim YI, et al. Dietary inflammatory index and the risk of gastric cancer in a Korean population. Oncotarget 2017;8:85452-85462.ArticlePubMedPMC
- 35. Kim SY, Eun CS, Han DS, Kim YS, Song KS, Choi BY, et al. A high glycemic index and glycemic load increased the risk of gastric cancer: a case-control study in Korea. Nutr Res 2022;105:11-19.ArticlePubMed
- 36. Chun YJ, Sohn SK, Song HK, Lee SM, Youn YH, Lee S, et al. Associations of colorectal cancer incidence with nutrient and food group intakes in Korean adults: a case-control study. Clin Nutr Res 2015;4:110-123.ArticlePubMedPMCPDF
- 37. Oh SY, Lee JH, Jang DK, Heo SC, Kim HJ. Relationship of nutrients and food to colorectal cancer risk in Koreans. Nutr Res 2005;25:805-813.Article
- 38. Lee J, Shin A, Oh JH, Kim J. Colors of vegetables and fruits and the risks of colorectal cancer. World J Gastroenterol 2017;23:2527-2538.ArticlePubMedPMC
- 39. Lee SY, Choi KY, Kim MK, Kim KM, Lee JH, Meng KH, et al. The relationship between intake of vegetables and fruits and colorectal adenoma-carcinoma sequence. Korean J Gastroenterol 2005;45:23-33 (Korean).PubMed
- 40. Kim JI, Park YJ, Kim KH, Kim JI, Song BJ, Lee MS, et al. hOGG1 Ser326Cys polymorphism modifies the significance of the environmental risk factor for colon cancer. World J Gastroenterol 2003;9:956-960.ArticlePubMedPMC
- 41. Kim J, Lee J, Oh JH, Chang HJ, Sohn DK, Kwon O, et al. Dietary lutein plus zeaxanthin intake and DICER1 rs3742330 A> G polymorphism relative to colorectal cancer risk. Sci Rep 2019;9:3406.ArticlePubMedPMCPDF
- 42. Cho YA, Lee J, Oh JH, Chang HJ, Sohn DK, Shin A, et al. Dietary flavonoids, CYP1A1 genetic variants, and the risk of colorectal cancer in a Korean population. Sci Rep 2017;7:128.ArticlePubMedPMCPDF
- 43. Kim J, Park S, Nam BH. The risk of colorectal cancer is associated with the frequency of meat consumption in a population-based cohort in Korea. Asian Pac J Cancer Prev 2011;12:2371-2376.PubMed
- 44. Ahn EJ, Lee RA, Chung SS, Kim KH, Park EB. The colorectal cancer risk of meat intake, smoking, and CYP2E1 polymorphisms: the comparison of colorectal cancer patients with controls. J Korean Surg Soc 2006;71:262-268 (Korean).
- 45. Song N, Lee J, Cho S, Kim J, Oh JH, Shin A. Evaluation of geneenvironment interactions for colorectal cancer susceptibility loci using case-only and case-control designs. BMC Cancer 2019;19:1231.ArticlePubMedPMCPDF
- 46. Kim NH, Seol JE, Kim J, Lee BH, Hwang DY, Jeong J, et al. Red meat intake, CYP2E1 and PPARγ polymorphisms, and colorectal cancer risk. Eur J Cancer Prev 2019;28:304-310.ArticlePubMed
- 47. Lee J, Shin A, Choi JY, Kang D, Lee JK. Adherence to the recommended intake of calcium and colorectal cancer risk in the HEXA study. Cancer Res Treat 2021;53:140-147.ArticlePubMedPDF
- 48. Han C, Shin A, Lee J, Lee J, Park JW, Oh JH, et al. Dietary calcium intake and the risk of colorectal cancer: a case control study. BMC Cancer 2015;15:966.ArticlePubMedPMC
- 49. Shin A, Lee J, Lee J, Park MS, Park JW, Park SC, et al. Isoflavone and soyfood intake and colorectal cancer risk: a case-control study in Korea. PLoS One 2015;10:e0143228.ArticlePubMedPMC
- 50. Kim Y, Lee J, Oh JH, Chang HJ, Sohn DK, Shin A, et al. The association between coffee consumption and risk of colorectal cancer in a Korean population. Nutrients 2021;13:2753.PubMedPMC
- 51. Kim H, Lee J, Oh JH, Chang HJ, Sohn DK, Shin A, et al. Protective effect of green tea consumption on colorectal cancer varies by lifestyle factors. Nutrients 2019;11:2612.ArticlePubMedPMC
- 52. Jun S, Lee J, Oh JH, Chang HJ, Sohn DK, Shin A, et al. Association of the inflammatory balance of diet and lifestyle with colorectal cancer among Korean adults: a case-control study. Epidemiol Health 2022;44:e2022084.ArticlePubMedPMCPDF
- 53. Kim J, Lee J, Oh JH, Chang HJ, Sohn DK, Shin A, et al. Interactive effect of the empirical lifestyle index for insulin resistance with the common genetic susceptibility locus rs2423279 for colorectal cancer. Br J Nutr 2023;129:1563-1573.Article
- 54. Cho YA, Lee J, Oh JH, Chang HJ, Sohn DK, Shin A, et al. Inflammatory dietary pattern, IL-17F genetic variant, and the risk of colorectal cancer. Nutrients 2018;10:724.ArticlePubMedPMC
- 55. Park Y, Lee J, Oh JH, Shin A, Kim J. Dietary patterns and colorectal cancer risk in a Korean population: a case-control study. Medicine (Baltimore) 2016;95:e3759.PubMedPMC
- 56. Cho YA, Lee J, Oh JH, Shin A, Kim J. Dietary inflammatory index and risk of colorectal cancer: a case-control study in Korea. Nutrients 2016;8:469.ArticlePubMedPMC
- 57. Lu YT, Gunathilake M, Lee J, Oh JH, Chang HJ, Sohn DK, et al. The interaction between glycemic index, glycemic load, and the genetic variant ADIPOQ T45G (rs2241766) in the risk of colorectal cancer: a case-control study in a Korean population. Eur J Nutr 2022;61:2601-2614.ArticlePubMedPDF
- 58. Lee EJ, Lee WK, Suh SW, Suh BH, Lee HS. Intakes of energy and nutrients and risk of breast cancer: case-control study in Daegu. Gyeongbuk area, Korea. J Nutr Health 2008;41:754-766 (Korean).
- 59. Do MH, Kim HJ, Lee SS, Jung PJ, Lee MH. Breast cancer risk and dietary factor: a case-control study. J Korean Surg Soc 2000;59:163-174 (Korean).
- 60. Kim JH, Lee J, Jung SY, Kim J. Dietary factors and female breast cancer risk: a prospective cohort study. Nutrients 2017;9:1331.ArticlePubMedPMC
- 61. Yu H, Hwang JY, Ro J, Kim J, Chang N. Vegetables, but not pickled vegetables, are negatively associated with the risk of breast cancer. Nutr Cancer 2010;62:443-453.ArticlePubMed
- 62. Do MH, Lee SS, Jung PJ, Lee MH. Intake of fruits, vegetables, and soy foods in relation to breast cancer risk in Korean women: a case-control study. Nutr Cancer 2007;57:20-27.ArticlePubMed
- 63. Lee EJ, Suh SW, Lee WK, Lee HS. Reproductive factor and food intake pattern influencing on the breast cancer risk in Daegu-Gyungbuk area, Korea. J Nutr Health 2007;40:334-346 (Korean).
- 64. Lee SA, Yoo KY, Noh DY, Choe KJ, Ahn SH, Park SK, et al. Diet and the risk of breast cancer in Korean women-a case-control study. J Korean Breast Cancer Soc 2003;6:271-276 (Korean).Article
- 65. Lee SA, Lee KM, Yoo KY, Noh DY, Ahn SH, Kang D. Combined effects of antioxidant vitamin and NOS3 genetic polymorphisms on breast cancer risk in women. Clin Nutr 2012;31:93-98.ArticlePubMed
- 66. Yang YJ, Hwang SH, Kim HJ, Nam SJ, Kong G, Kim MK. Dietary intake of nitrate relative to antioxidant vitamin in relation to breast cancer risk: a case-control study. Nutr Cancer 2010;62:555-566.ArticlePubMed
- 67. Do MH, Lee SS, Jung PJ, Lee MH. Intake of dietary fat and vitamin in relation to breast cancer risk in Korean women: a case-control study. J Korean Med Sci 2003;18:534-540.ArticlePubMedPMC
- 68. Song H, Jeong A, Tran TX, Lee J, Kim M, Park B. Association between micronutrient intake and breast cancer risk according to body mass index in South Korean adult women: a cohort study. Nutrients 2022;14:2644.ArticlePubMedPMC
- 69. Cho YA, Kim J, Park KS, Lim SY, Shin A, Sung MK, et al. Effect of dietary soy intake on breast cancer risk according to menopause and hormone receptor status. Eur J Clin Nutr 2010;64:924-932.ArticlePubMedPDF
- 70. Kim J, Lim SY, Shin A, Sung MK, Ro J, Kang HS, et al. Fatty fish and fish omega-3 fatty acid intakes decrease the breast cancer risk: a case-control study. BMC Cancer 2009;9:216.ArticlePubMedPMCPDF
- 71. Shin WK, Lee HW, Shin A, Lee JK, Kang D. Milk consumption decreases risk for breast cancer in Korean women under 50 years of age: results from the Health Examinees Study. Nutrients 2019;12:32.ArticlePubMedPMC
- 72. Shin WK, Lee HW, Shin A, Lee JK, Lee SA, Lee JE, et al. Multigrain rice diet decreases risk of breast cancer in Korean women: results from the Health Examinees Study. Nutrients 2020;12:2273.ArticlePubMedPMC
- 73. Lee S, Quiambao AL, Lee J, Ro J, Lee ES, Jung SY, et al. Dietary inflammatory index and risk of breast cancer based on hormone receptor status: a case-control study in Korea. Nutrients 2019;11:1949.ArticlePubMedPMC
- 74. Woo HD, Park KS, Shin A, Ro J, Kim J. Glycemic index and glycemic load dietary patterns and the associated risk of breast cancer: a case-control study. Asian Pac J Cancer Prev 2013;14:5193-5198.ArticlePubMed
- 75. Cho YA, Kim J, Shin A, Park KS, Ro J. Dietary patterns and breast cancer risk in Korean women. Nutr Cancer 2010;62:1161-1169.ArticlePubMed
- 76. Yun SH, Kim K, Nam SJ, Kong G, Kim MK. The association of carbohydrate intake, glycemic load, glycemic index, and selected rice foods with breast cancer risk: a case-control study in South Korea. Asia Pac J Clin Nutr 2010;19:383-392.PubMed
- 77. Cho YA, Lee J, Kim J. Association between nutrient intake and thyroid cancer risk in Korean women. Nutr Res Pract 2016;10:336-341.ArticlePubMedPMCPDF
- 78. Jung SK, Kim K, Tae K, Kong G, Kim MK. The effect of raw vegetable and fruit intake on thyroid cancer risk among women: a case-control study in South Korea. Br J Nutr 2013;109:118-128.ArticlePubMed
- 79. Song SS, Huang S, Park S. Association of polygenetic risk scores related to cell differentiation and inflammation with thyroid cancer risk and genetic interaction with dietary intake. Cancers (Basel) 2021;13:1510.ArticlePubMedPMC
- 80. Sreeja SR, Lee HY, Kwon M, Shivappa N, Hebert JR, Kim MK. Dietary Inflammatory Index and its relationship with cervical carcinogenesis risk in Korean women: a case-control study. Cancers (Basel) 2019;11:1108.ArticlePubMedPMC
- 81. Sreeja SR, Seo SS, Kim MK. Associations of dietary glycemic index, glycemic load and carbohydrate with the risk of cervical intraepithelial neoplasia and cervical cancer: a case-control study. Nutrients 2020;12:3742.ArticlePubMedPMC
- 82. Kim J, Kim MK, Lee JK, Kim JH, Son SK, Song ES, et al. Intakes of vitamin A, C, and E, and beta-carotene are associated with risk of cervical cancer: a case-control study in Korea. Nutr Cancer 2010;62:181-189.PubMed
- 83. Woo HD, Kim J. Nutritional epidemiology of cancer in Korea: recent accomplishments and future directions. Asian Pac J Cancer Prev 2011;12:2377-2383.PubMed
- 84. Woo HD, Park S, Oh K, Kim HJ, Shin HR, Moon HK, et al. Diet and cancer risk in the Korean population: a meta-analysis. Asian Pac J Cancer Prev 2014;15:8509-8519.ArticlePubMed
- 85. Shikata K, Kiyohara Y, Kubo M, Yonemoto K, Ninomiya T, Shirota T, et al. A prospective study of dietary salt intake and gastric cancer incidence in a defined Japanese population: the Hisayama study. Int J Cancer 2006;119:196-201.ArticlePubMed
- 86. Kim HJ, Lim SY, Lee JS, Park S, Shin A, Choi BY, et al. Fresh and pickled vegetable consumption and gastric cancer in Japanese and Korean populations: a meta-analysis of observational studies. Cancer Sci 2010;101:508-516.ArticlePubMed
- 87. Kodama K, Sumii K, Kawano M, Kido T, Nojima K, Sumii M, et al. Gastric juice nitrite and vitamin C in patients with gastric cancer and atrophic gastritis: is low acidity solely responsible for cancer risk? Eur J Gastroenterol Hepatol 2003;15:987-993.PubMed
- 88. Kim J, Kang M, Lee JS, Inoue M, Sasazuki S, Tsugane S. Fermented and non-fermented soy food consumption and gastric cancer in Japanese and Korean populations: a meta-analysis of observational studies. Cancer Sci 2011;102:231-244.ArticlePubMed
- 89. Ganesan K, Du B, Chen J. Effects and mechanisms of dietary bioactive compounds on breast cancer prevention. Pharmacol Res 2022;178:105974.ArticlePubMed
- 90. Jideani AI, Silungwe H, Takalani T, Omolola AO, Udeh HO, Anyasi TA. Antioxidant-rich natural fruit and vegetable products and human health. Int J Food Prop 2021;24:41-67.Article
- 91. He Y, Wang B, Wen L, Wang F, Yu H, Chen D, et al. Effects of dietary fiber on human health. Food Sci Hum Wellness 2022;11:1-10.Article
- 92. Grosso G, Godos J, Galvano F, Giovannucci EL. Coffee, caffeine, and health outcomes: an umbrella review. Annu Rev Nutr 2017;37:131-156.ArticlePubMedPDF
- 93. Bouvard V, Loomis D, Guyton KZ, Grosse Y, Ghissassi FE, Benbrahim-Tallaa L, et al. Carcinogenicity of consumption of red and processed meat. Lancet Oncol 2015;16:1599-1600.ArticlePubMed
- 94. Gamage SM, Dissabandara L, Lam AK, Gopalan V. The role of heme iron molecules derived from red and processed meat in the pathogenesis of colorectal carcinoma. Crit Rev Oncol Hematol 2018;126:121-128.ArticlePubMed
- 95. Papadimitriou N, Markozannes G, Kanellopoulou A, Critselis E, Alhardan S, Karafousia V, et al. An umbrella review of the evidence associating diet and cancer risk at 11 anatomical sites. Nat Commun 2021;12:4579.ArticlePubMedPMCPDF
- 96. Cruz-Pierard SM, Nestares T, Amaro-Gahete FJ. Vitamin D and calcium as key potential factors related to colorectal cancer prevention and treatment: a systematic review. Nutrients 2022;14:4934.ArticlePubMedPMC
- 97. Fuszek P, Lakatos P, Tabak A, Papp J, Nagy Z, Takacs I, et al. Relationship between serum calcium and CA 19-9 levels in colorectal cancer. World J Gastroenterol 2004;10:1890-1892.ArticlePubMedPMC
- 98. World Cancer Research Fund International. Systematic literature review: the associations between food, nutrition and physical activity and the risk of cervical cancer. [cited 2023 May 1]. Available from: https://www.wcrf.org/wp-content/uploads/2021/02/Cervical-cancer-slr.pdf.
REFERENCES
Figure & Data
References
Citations
 PubReader
 ePub Link
 Cite
Cite- Figure
-

- Related articles
-
- Effectiveness of community-based interventions for older adults living alone: a systematic review and meta-analysis
- Cancer risk based on alcohol consumption levels: a comprehensive systematic review and meta-analysis
- Associations of daily diet-related greenhouse gas emissions with the incidence and mortality of chronic diseases: a systematic review and meta-analysis of epidemiological studies
- The prevalence of Q fever in the Eastern Mediterranean region: a systematic review and meta-analysis
- The relationship between metabolic syndrome and its components with bladder cancer: a systematic review and meta-analysis of cohort studies

