
Articles
- Page Path
- HOME > Epidemiol Health > Volume 46; 2024 > Article
-
Special Article
Incidence and case fatality of stroke in Korea, 2011-2020 -
Jenny Moon1*
 , Yeeun Seo1*, Hyeok-Hee Lee2,3,4, Hokyou Lee2,3,4, Fumie Kaneko1, Sojung Shin1, Eunji Kim2, Kyu Sun Yum5, Young Dae Kim6, Jang-Hyun Baek7, Hyeon Chang Kim2,4
 -
Epidemiol Health 2023;46:e2024003.
DOI: https://doi.org/10.4178/epih.e2024003
Published online: December 26, 2023
1Department of Public Health, Yonsei University Graduate School, Seoul, Korea
2Department of Preventive Medicine, Yonsei University College of Medicine, Seoul, Korea
3Department of Internal Medicine, Yonsei University College of Medicine, Seoul, Korea
4Institute for Innovation in Digital Healthcare, Yonsei University, Seoul, Korea
5Department of Neurology, Chungbuk National University Hospital, Cheongju, Korea
6Department of Neurology, Yonsei University College of Medicine, Seoul, Korea
7Department of Neurology, Kangbuk Samsung Hospital, Sungkyunkwan University School of Medicine, Seoul, Korea
- Correspondence: Hyeon Chang Kim Department of Preventive Medicine, Yonsei University College of Medicine, 50-1 Yonsei-ro, Seodaemun-gu, Seoul 03722, Korea E-mail: hckim@yuhs.ac
- Co-correspondence: Jang-Hyun Baek Department of Neurology, Kangbuk Samsung Hospital, Sungkyunkwan University School of Medicine, 29 Saemunan-ro, Jongno-gu, Seoul 03181, Korea E-mail: janghyun.baek@gmail.com
- *Moon & Seo contributed equally to this work as joint first authors.
© 2024, Korean Society of Epidemiology
This is an open-access article distributed under the terms of the Creative Commons Attribution License (http://creativecommons.org/licenses/by/4.0/), which permits unrestricted use, distribution, and reproduction in any medium, provided the original work is properly cited.
- 4,321 Views
- 107 Download
Abstract
-
OBJECTIVES
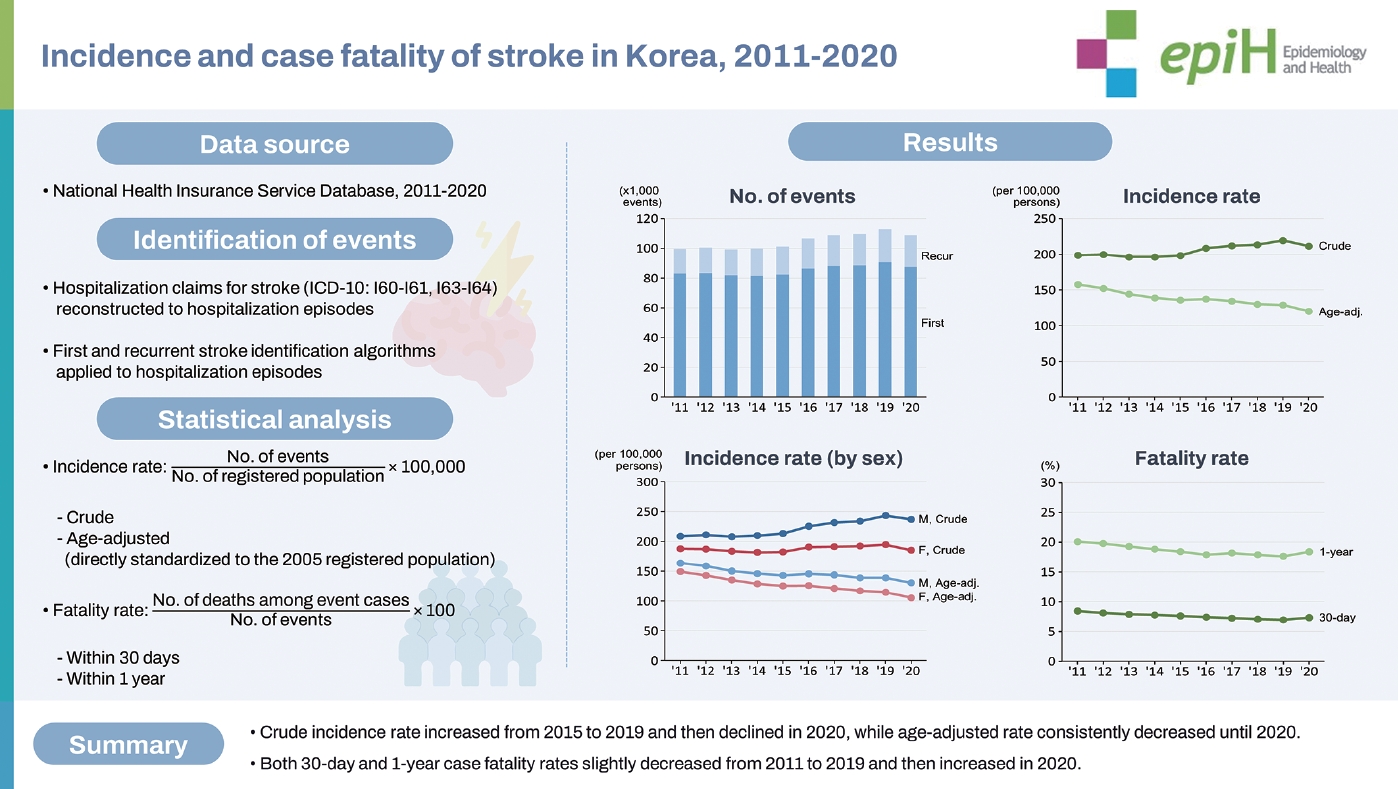
- Stroke remains the second leading cause of death in Korea. This study was designed to estimate the crude, age-adjusted and age-specific incidence rates, as well as the case fatality rate of stroke, in Korea from 2011 to 2020.
-
METHODS
- We utilized data from the National Health Insurance Services from January 1, 2002 to December 31, 2020, to calculate incidence rates and 30-day and 1-year case fatality rates of stroke. Additionally, we determined sex and age-specific incidence rates and computed age-standardized incidence rates by direct standardization to the 2005 population.
-
RESULTS
- The crude incidence rate of stroke hovered around 200 (per 100,000 person-years) from 2011 to 2015, then surged to 218.4 in 2019, before marginally declining to 208.0 in 2020. Conversely, the age-standardized incidence rate consistently decreased by 25% between 2011 and 2020. When stratified by sex, the crude incidence rate increased between 2011 and 2019 for both sexes, followed by a decrease in 2020. Age-standardized incidence rates displayed a downward trend throughout the study period for both sexes. Across all age groups, the 30-day and 1-year case fatality rates of stroke consistently decreased from 2011 to 2019, only to increase in 2020.
-
CONCLUSIONS:
- Despite a decrease in the age-standardized incidence rate, the total number of stroke events in Korea continues to rise due to the rapidly aging population. Moreover, 2020 witnessed a decrease in incidence but an increase in case fatality rates.
- This nationwide study using Korean National Health Insurance System data reveals a decade-long downward trend in overall stroke incidence rates. While the crude incidence rate showed a temporary increase from 2016 to 2019 before a slight decline in 2020, the age-standardized incidence rate consistently decreased over the study period. The study emphasizes the significance of continuous monitoring and preventive strategies to address stroke as a public health concern in Korea
Key Message
- According to the Global Burden of Diseases, Injuries, and Risk Factors Study, stroke is the second most common cause of death and the third most common cause of disability-adjusted life-years (DALYs) worldwide [1-3]. In Korea, stroke also stands as the second most common cause of death and DALYs, accounting for approximately 12% of all deaths and 7% of all DALYs in the country [4].
- Over the past 2 decades, studies have been leveraging health insurance claims data, such as the Korea Medical Insurance Corporation study and the Korean National Health System Prospective Cohort study, to explore cardiovascular diseases and their risk factors. However, the primary aims of these studies are not to investigate the trends of cardiovascular diseases, with incidence rates often derived as secondary outcomes during the analysis process [5,6]. In 2020, the Korean Neurosurgical Society presented a noteworthy comprehensive analysis of stroke incidence trends in Korea from 2008 to 2016, utilizing national health insurance big data to analyze the trends surrounding stroke incidence in the country during that period [7,8].
- The National Health Insurance System (NHIS) in Korea, due to its comprehensive coverage of the entire population, serves as an invaluable resource in offering insights into severe conditions such as stroke. However, while assessing stroke incidence trends, it is crucial to recognize the challenges introduced by divergent event-identification methods and data sources used in different studies. Nonetheless, exclusive reliance on claim diagnosis codes may not offer immediate or accurate estimations of incidence rates. Thus, the aim of this study was to estimate both the incidence and case fatality rates of acute stroke events in Korea over the period from 2011 to 2020 using a newly devised and reliable methodology based on claims data.
INTRODUCTION
- Data source
- We used the nationwide anonymized health information database of the NHIS, which is the single provider of mandatory health insurance, covering approximately 97% of the Korean population. Organized by the NHIS, the National Health Insurance (NHI) Big Data contains socio-demographics, hospital claims with International Classification of Diseases, 10th revision (ICD-10) coding, and fatality data of the entire population of Korea [9]. It is important to note that the fatality data included in our study are not directly linked to the records of the National Statistical Office.
- Ascertainment of stroke events
- The data extraction was focused on patients admitted for stroke based on ICD-10 diagnosis codes (I60, I61, I63, I64) between January 1, 2002 and December 31, 2020. All relevant health insurance claim records were retrieved for these subjects. Health insurance claims data often associate multiple claims with a single disease event, necessitating the consolidation of various claim codes pertaining to drug prescriptions, diagnostic tests, and procedures. These codes can be scattered across multiple claims, complicating a comprehensive and accurate understanding of the disease episode. Consequently, we introduced the concept of a “hospitalization episode.” In short, 2 consecutive insurance claims, A and B, were considered separate hospitalization episodes under 2 conditions: (1) if the gap between the initial dates of claims A and B exceeded 28 days, and (2) if the interval between the final date of claim A and the initial date of claim B was 3 days or more. This method facilitated a more effective capture of the complete range of patient treatment and outcomes tied to each distinct hospitalization episode.
- Each hospitalization episode served as the subject for stroke event identification. We developed specific identification algorithms for the first and recurrent stroke events, as detailed in Table 1; the detailed methods have been published elsewhere [10]. Although both algorithms primarily relied on the use of ICD-10 diagnosis codes (I60, I61, I63, I64), the algorithm for recurrent events included additional rigorous criteria. These diagnosis codes were supplemented with relevant diagnostic test and/or procedure codes.
- To ensure the accuracy of these stroke identification algorithms, we conducted a retrospective review of medical records. This review included a total of 1,741 events from 24 hospitals throughout Korea, including 5 tertiary, 11 secondary, and 8 primary hospitals. We developed epidemiological adjudication criteria grounded on the 2013 American Heart Association/American Stroke Association definition of stroke [11], albeit with modifications, to determine the validity of each event identified by the algorithms. Positive predictive values (PPVs) were calculated by dividing the number of algorithm-identified events adjudicated as true acute stroke cases by the total number of algorithm-identified events examined. PPVs were calculated separately for first and recurrent events, as well as by hospital type (tertiary, secondary, and primary). The methodology for the design of these identification algorithms has been separately reported.
- Statistical analysis
- We calculated both crude and age-standardized incidence rates of stroke (per 100,000 person-years) throughout the duration of the study period. Direct age-standardized rates were calculated using the 2005 Korean population to facilitate the comparison of yearly rates. To compare incidence rates between males and females, we calculated sex-specific incidence rates using similar methods, utilizing separate standard populations for each sex. Additionally, we calculated the case fatality rate of stroke in 2 forms: the 30-day fatality rate and the 1-year fatality rate. Across the period from 2011 to 2020, we computed both aggregate and age-stratified case fatality rates. The age groups were categorized into 40-64 years, 65-79 years, and 80 years or older. All statistical analyses were conducted using R version 4.0.3 (R Foundation for Statistical Computing, Vienna, Austria).
- Ethics statement
- This study complied with the Declaration of Helsinki, and the study protocol was approved by the Institutional Review Board (IRB) of Yonsei University Health System, Seoul, Korea (#4-2022-0586). Informed consent was waived by the IRB. Informed consent was waived since this was a retrospective study of de-identified administrative data.
MATERIALS AND METHODS
- Number of stroke events, 2011-2020
- Table 2 shows the number of identified stroke events during our study period. From 2011 to 2015, the total number of stroke events remained relatively consistent, with approximately 100,000 cases reported annually. From 2016 to 2019, there was a gradual increase in cases, before a minor decline to 106,807 cases in 2020. The trend in the number of first stroke events closely paralleled the trend in total stroke events. Conversely, the number of recurrent stroke events exhibited a steady rise from 2011 to 2019, followed by a slight decrease in 2020. The proportion of recurrent stroke among all stroke events also showed an upward trajectory, increasing from 16.6% in 2011 to 19.0% in 2020. When stratified by sex, the number of first stroke events in males increased from 2011 to 2019 but decreased in 2020, while the corresponding number in females remained relatively stable. As for the number of recurrent stroke events, both males and females experienced a substantial increase from 2011 to 2019, with decrease in 2020. Notably, the rate of increase in the number of stroke events was more pronounced in males compared to females, resulting in an increase in the male-to-female ratio from 1.1 in 2011 to 1.3 in 2020.
- Age-stratified number of stroke events, 2011-2020
- Table 3 provides an overview of stroke incidence trends from 2011 to 2020, categorized by age groups. Among individuals under 20 years of age, the total number of stroke incidence events showed a decrease from 579 in 2011 to 349 in 2020. Specifically, first stroke events decreased from 520 in 2011 to 312 in 2020, while recurrent cases dropped from 59 in 2011 to 37 in 2020. For those in the 20-29 age group, there was a decline in the total number of stroke events, from 583 in 2011 to 540 in 2020. First stroke events decreased from 527 in 2011 to 471 in 2020, whereas recurrences increased from 56 in 2011 to 69 in 2020. In the age group of 30-39, the number declined from 2,144 to 1,846. A similar decreasing trend was observed in the 40-49 age group, where stroke events decreased from 7,775 to 6,230. Similarly, the 50-59 age group experienced a decline from 16,795 to 16,102, and the 60-69 age group showed a decrease from 21,541 to 24,240. Among those aged 70-79, the total number of stroke events reduced from 32,061 in 2012 to 28,143 in 2020. For individuals aged 80 and above, there was a decrease from 19,035 incidents in 2011 to 29,177 in 2020. Overall, increasing trends were observed across total, first, and recurrent stroke events, with prominence in the age groups of 60-69 and those aged 80 and above.
- The age-stratified data was further subdivided by sex, as shown in Supplementary Materials 1 and 2. Among males, there was an increase in the number of stroke incidence events in the age groups of 50-59, 60-69, 70-79, and 80 and above from 2011 to 2020. Additionally, with each advancing age group, there was a corresponding rise in the incidence of total, first, and recurrent strokes. For females, there was an increasing trend in the number of stroke incidence events observed in the age group of 80 and above from 2011 to 2020.
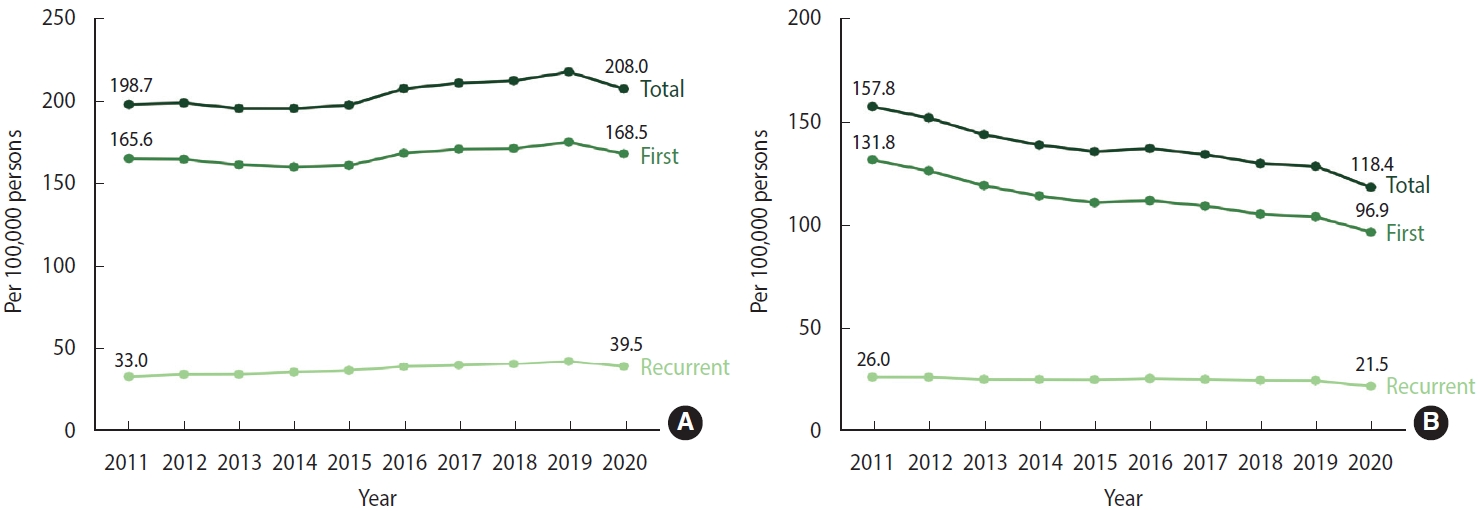
- Incidence rate of stroke, 2011-2020
- Between 2011 and 2015, the overall crude incidence rate of stroke (per 100,000 person-years) remained relatively stable at around 200. However, from 2016 to 2019, the rate experienced an increase, reaching a peak of 218.4, before slightly declining to 208.0 in 2020 (Figure 1A, Supplementary Material 3). The incidence rate of first stroke followed a similar trend to the total stroke events. During the same period, the incidence of recurrent stroke steadily increased from 2011 to 2019 and then showed a slight decrease in 2020. In contrast, the age-standardized incidence rate of stroke (per 100,000 person-years) exhibited a consistent decline, dropping from 157.8 in 2011 to 118.4 in 2020. The age-standardized incidence rates of total, first, and recurrent stroke displayed a similar trend to the overall incidence rate (Figure 1B, Supplementary Material 4).
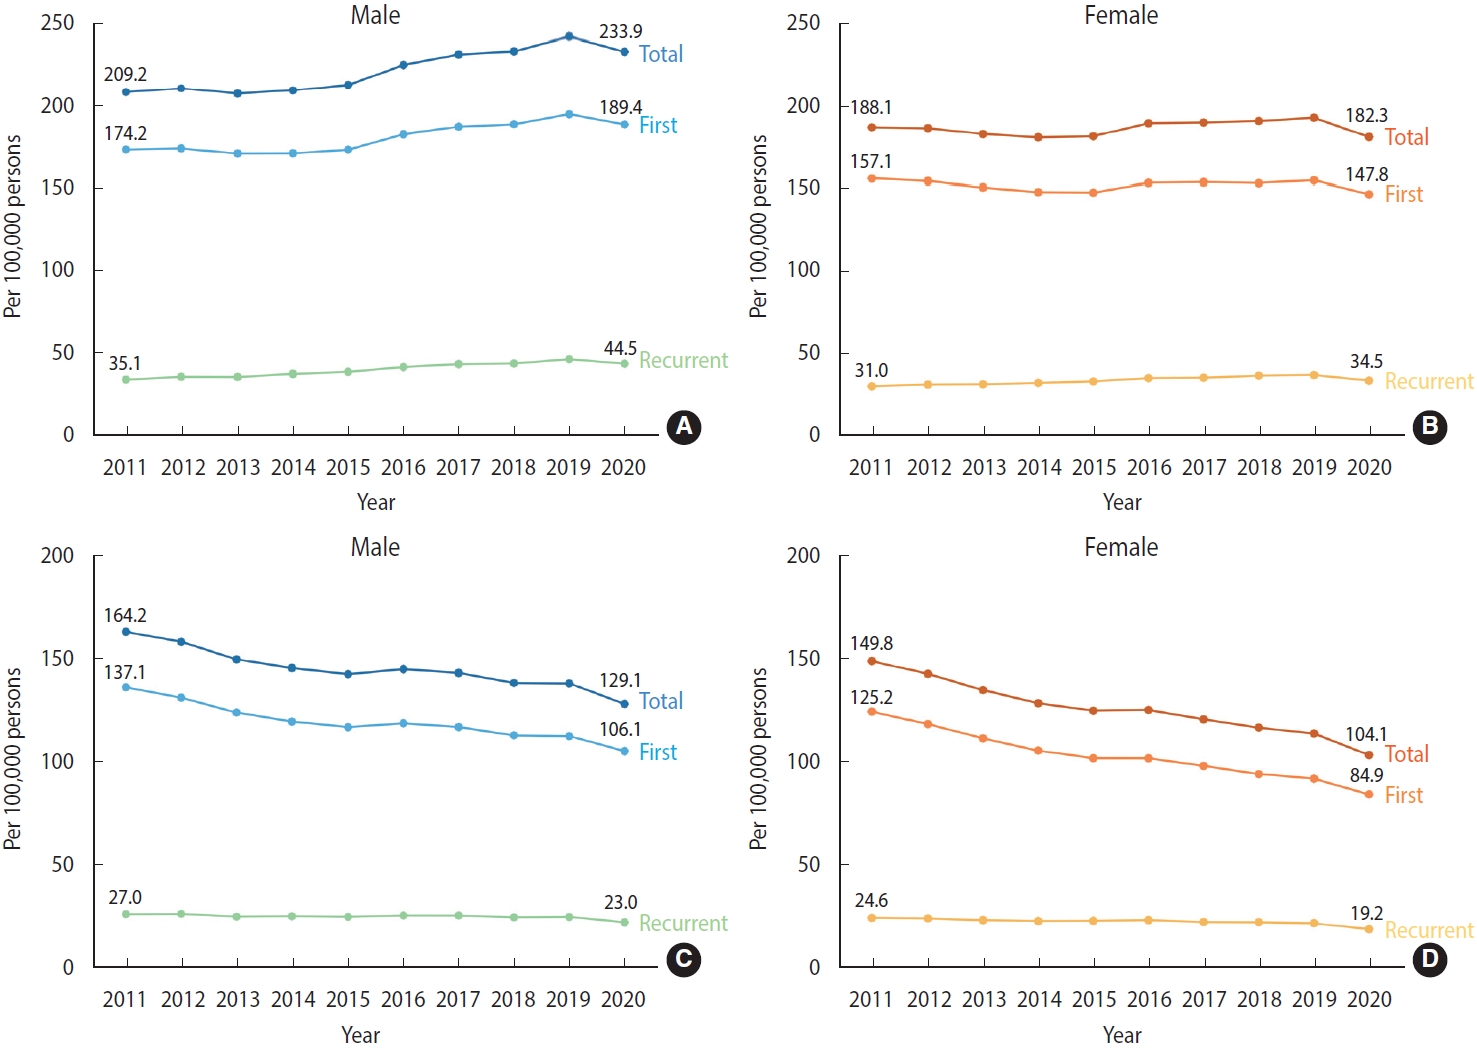
- When examining the incidence rates by sex, the crude incidence rate in males remained stable from 2011 to 2015, but experienced an increase starting in 2016, reaching a peak of 242.9 per 100,000 person-years in 2019, and then slightly decreased in 2020 (Figure 2A, Supplementary Material 5). In females, the incidence rates for total, first, and recurrent stroke increased from 2011 to 2019 and then decreased in 2020 (Figure 2B, Supplementary Material 5). The age-standardized incidence rates for both total and first stroke consistently decreased from 2011 to 2020 for both males and females. However, the age-standardized rate of recurrent stroke displayed similar trends between the sexes. In both males and females, the rate maintained relative stability from 2011 to 2019, with a slight decrease observed in 2020 (Figure 2C and D, Supplementary Material 6).
- Case fatality rate of stroke, 2011-2020
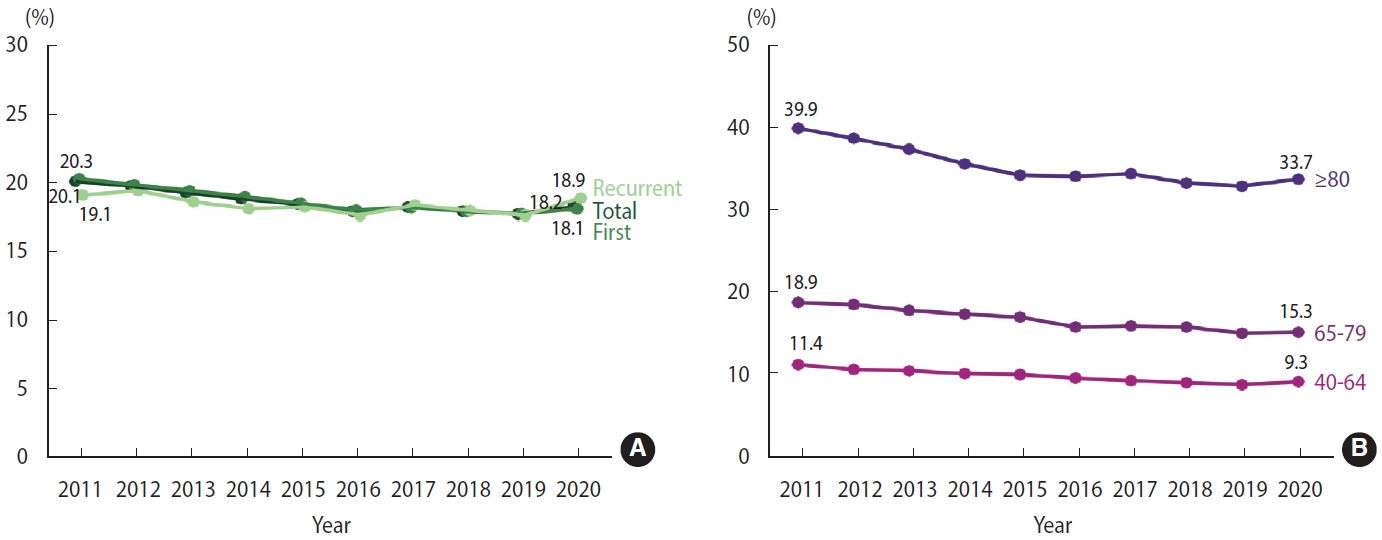
- From 2011 to 2019, there was a reduction in the 30-day case fatality rates for both total stroke and first stroke, with rates decreasing from 8.5% to 7.4% and 9.0% to 7.7%, respectively. However, in 2020, both measures showed a slight upward trend. In the case of recurrent stroke, the 30-day case fatality rate remained relatively stable from 2011 to 2019 but showed an increase in 2020, reaching a peak of 6.1% (Figure 3A, Supplementary Material 7). When we further stratified the analysis into 3 age groups, we observed similar patterns across all categories. For stroke patients in the 40-64, 65-79, and ≥ 80 age groups, there was a consistent decline in the 30-day case fatality rates from 2011 to 2019. However, a reversal of this trend, marking an increase, was observed in 2020 (Figure 3B, Supplementary Material 8).
- The 1-year case fatality rates for both total stroke and first stroke declined from around 20% in 2011 to approximately 18% in 2016, after which the rates remained stable until 2019, then slightly increased to about 18% in 2020. The 1-year case fatality rate for recurrent stroke displayed fluctuating trends, with an overall decline from 2011 to 2019, followed by an increase to 18.9% in 2020 (Figure 4A, Supplementary Material 9). These trends were evident across all age groups from 2011 to 2019, suggesting that factors other than age-structure changes impacted the 1-year case fatality rate. When the data were stratified into 3 age groups, a higher 1-year case fatality rate for stroke was observed in the older cohorts. Despite an overall downward trend from 2011 to 2019 across all age groups, the 1-year case fatality rate for stroke saw an upturn in 2020 (Figure 4B, Supplementary Material 10).
- Positive predictive values of the identification algorithms for stroke events
- The PPVs of the algorithms used to identify initial and recurrent stroke events across different hospital types are outlined in Supplementary Material 11. The algorithm for identifying first stroke events demonstrated a PPV of 83.4% in tertiary hospitals, 94.1% in secondary hospitals, and 70.2% in primary hospitals. When fatal events where the cause of death was recorded as stroke were considered as positive events, the PPV increased to 70.7% in primary hospitals, while remaining unchanged in secondary and tertiary hospitals. The crude pooled PPV was 82.3%. When weighted according to the medical institution first visited and the highest-level medical institution during the episode, it was 88.2% and 88.1%, respectively.
- The recurrent stroke identification algorithm exhibited a PPV of 75.7% in tertiary hospitals, 89.0% in secondary hospitals, and 63.3% in primary hospitals. When stroke-related fatalities were considered as positive events, the PPV increased to 65.6% in primary hospitals, with no changes observed in tertiary and secondary hospitals. The crude pooled PPV of the recurrent stroke identification algorithm was 78.4%, and the weighted pooled PPV according to medical institution first visited and the highest-level medical institution during the episode stood at 80.8% and 81.0%, respectively.
RESULTS
- This study provides a detailed examination of the decade-long trends in the incidence and case fatality rates of stroke in Korea. The crude overall incidence rate of stroke was observed to remain steady from 2011 to 2015, subsequently increase from 2016 to 2019, and then slightly decline in 2020. However, the age-standardized incidence rate exhibited a consistent decrease throughout the study period. When stratified by sex, the crude incidence rate in males showed an upward trend, whereas in females it remained relatively stable. The case fatality rates for both total and first stroke events decreased until 2016, remained stable until 2019, and then increased in 2020. Notably, the 1-year case fatality rates were significantly higher in older age groups. The potential impact of the coronavirus disease 2019 (COVID-19) pandemic in 2020 on healthcare accessibility, including access to medical systems, as well as its broader societal and cultural implications, necessitates a thoughtful and cautious interpretation of its effects on the accuracy of the identification algorithms.
- In 2018, the Korean Stroke Society released an executive summary of stroke statistics in Korea, which was based on data obtained from the NHIS database [12]. The study found that the age-standardized and sex-standardized incidence rate of first stroke in Korea decreased from 105.8 (per 100,000 person-years) in 2007 to 92.2 (per 100,000 person-years) in 2013. The study also employed a stroke identification algorithm for claims data, which was developed and validated using a multicenter stroke registry database [13]. This algorithm selected 17 key identifiers from the claims data and established 37 conditions through combinations of these key identifiers. While this algorithm aimed to maximize the distinction between true and false acute stroke events, it required a larger amount of clinical data and might be more susceptible to changes in treatment patterns and health insurance policies. In contrast, our study utilized a more practical algorithm to monitor the annual occurrence trends of stroke over the long term while maintaining an acceptable PPV. Another Korean study analyzed NHIS data and reported that the stroke incidence rate among individuals with disabilities was 2.5 times higher than that among non-disabled individuals [14]. However, in this study, stroke was defined solely based on diagnostic codes. Other countries have also conducted studies on the incidence rate of stroke. In Japan, studies on stroke incidence utilized various methods, including registration systems at the prefecture or city level, community cohort studies, and medical institution network studies. These studies followed standardized diagnostic criteria, such as the WHO-MONICA criteria or case report forms to accurately document and diagnose strokes [15,16]. For instance, when comparing stroke incidence between urban and rural communities in Japan, significant declines in age-standardized incidence rates were observed [15]. In urban communities, the incidence decreased from 6.60 to 1.15 (per 1,000 person-years) for males and 3.28 to 0.59 for females. Similarly, in rural communities, the corresponding incidence decreased from 11.51 to 1.98 for males and 6.46 to 1.31 for females. In Takashima City, the age-standardized and sex-standardized incidence rates of stroke (per 100,000 person-years) decreased from 327 in the early period of the study (1990 to 2001) to 206 in the later period (2002 to 2010) [16]. In Taiwan, stroke incidence rates were also monitored using the NHI Research Database. Here, new stroke incidence was defined based on whether imaging tests such as computed tomography or magnetic resonance imaging were conducted during the acute treatment period [17]. Between 2004 and 2011, the age-adjusted incidence of all strokes (per 100,000 person-years) in Taiwan decreased by 16%, from 251 to 210. Overall, these findings suggest that both Japan and Taiwan have seen significant declines in stroke incidence over the years; however, the absence of an established system for producing disease statistics makes it difficult to update statistics consistently every year.
- This study has several strengths that contribute to its robustness. First, it is a nationwide study that offers a comprehensive examination of stroke incidence and case fatality rate trends over a 10-year period in Korea. The use of a large database, the NHIS, which covers approximately 97% of the Korean population, ensured a representative sample. Moreover, the study analyzed trends based on sex and age groups, providing a detailed understanding of variations in stroke incidence and case fatality rates among different population segments. A notable feature of this study is the production of crucial data concerning recurrent stroke events. This emphasizes the importance of strategies aimed at preventing recurrent strokes and efficiently managing stroke risk factors, with the ultimate objective of reducing the overall societal and individual burden associated with stroke.
- However, it is important to acknowledge the limitations of our study. First, we must consider that the COVID-19 pandemic in 2020 may have decreased the accessibility of medical services, a significant factor that could impact the analysis results within our study. Second, special attention is needed when interpreting the fatality rates for individuals aged 80 and above. The increased mortality in this age group may be influenced by various complex factors or be attributed to natural causes associated with aging, implying that these fatality rates may not exclusively represent the direct outcomes of stroke incidence. Third, the use of health insurance claim data introduces the potential for overlooked stroke cases among individuals not seeking medical care or those experiencing stroke events outside the country. Changes in diagnostic tools and healthcare systems can also influence observed incidence rates. Complementary studies should focus on assessing the incidence of events within the community where medical care was not sought. Fourth, efforts were made to strengthen validity by incorporating information on diagnostic tests and interventional treatments alongside diagnosis codes. However, we were unable to access test results. To address this limitation, a validation study employing medical record investigations was conducted, revealing a PPV of 88.6%. While this value may not be entirely satisfactory, it is comparable to findings from other international studies and offers a usable level for monitoring stroke incidence rates. Fifth, it should be noted that the NHIS database does not contain information on drug prescriptions, examinations, or procedures not covered by the NHIS scheme. For instance, if a stroke patient undergoes brain imaging without health insurance reimbursement, the case may not be identified as a stroke event due to the absence of information on brain imaging in the database. Finally, this study did not consider the subtypes of stroke (ischemic vs. hemorrhagic). To accurately discern stroke subtypes, detailed clinical information and examination results are vital. Consequently, hospital-based registry studies are necessary. These studies would enable the comprehensive collection of clinical data and diagnostic information, thereby paving the way for a more granular analysis of stroke subtypes.
DISCUSSION
- This nationwide study offers crucial insights into the trends of stroke incidence and case fatality rates in Korea, and its strengths include the use of a large-scale database and the analysis of trends segmented by sex and age groups. Nonetheless, it is essential to recognize the limitations inherent to the use of health insurance claims data, the necessity for community-focused studies, certain data usage restrictions, and the requirement for hospital-based registry studies to accurately determine stroke subtypes. While our findings depict a decade-long downward trend in stroke incidence, stroke continues to be a significant public health concern in Korea, contributing substantially to fatality and disability rates. This study serves as a valuable resource for clinicians, researchers, healthcare policymakers, and the public. By providing comprehensive national data on stroke, it aids in the creation of healthcare plans and paves the way for future research, ultimately enhancing the prevention, management, and treatment of cardiovascular diseases.
CONCLUSION
Supplementary materials
Supplementary Material 1.
Supplementary Material 2.
Supplementary Material 3.
Supplementary Material 4.
Supplementary Material 5.
Supplementary Material 6.
Supplementary Material 7.
Supplementary Material 8.
Supplementary Material 9.
Supplementary Material 10.
Supplementary Material 11.
-
Conflict of interest
The authors have no conflicts of interest to declare for this study.
-
Funding
This work was based on the outcomes of the “2022 National Cardiovascular Diseases Statistics Production System” project, supported by the Korea Disease Control and Prevention Agency (KDCA).
-
Author contributions
Data curation: Lee HH, Lee H, Kim HC. Formal analysis: Lee HH, Lee H, Kim HC. Funding acquisition: Kim HC. Methodology: Lee HH, Lee H. Project administration: Moon J, Seo Y, Yum KS, Kim YD, Baek JH, Kim HC. Visualization: Kaneko F, Shin S. Writing – original draft: Moon J, Seo Y. Writing – review & editing: Lee HH, Lee H, Kaneko F, Shin S, Kim E, Yum KS, Kim YD, Baek JH, Kim HC.
NOTES
ACKNOWLEDGEMENTS

| Event | Diagnosis codes (ICD-10) | Identification algorithm |
|---|---|---|
| First | Primary, I63-I64 (+) | (Brain imaging and [episode length ≥3 days or death]) or therapeutic intervention1 or death |
| Primary, I63-I64 (-); All, I60-I61 (+) | (Brain imaging and [episode length ≥3 days or death]) or therapeutic intervention1 or death | |
| Primary, I63-I64 (-); All, I60-I61 (-); Secondary or lower, I63-I64 (+) | Therapeutic intervention1 and (episode length ≥3 days or death) | |
| Recurrent | Primary, I63-I64 (+) | (Brain imaging or therapeutic intervention1) and (episode length ≥3 days or death |
| Primary, I63-I64 (-); Primary, I60-I61 (+) | (Brain imaging or therapeutic intervention1) and (episode length ≥3 days or death) | |
| Primary, I60-I61, I63-I64 (-); Secondary or lower, I60-I61, I63-I64 (+) | Therapeutic intervention1 and (episode length ≥3 days or death) |
- 1. GBD 2017 DALYs and HALE Collaborators. Global, regional, and national disability-adjusted life-years (DALYs) for 359 diseases and injuries and healthy life expectancy (HALE) for 195 countries and territories, 1990-2017: a systematic analysis for the Global Burden of Disease Study 2017. Lancet 2018;392:1859-1922 https://doi.org/10.1016/S0140-6736(18)32335-3.ArticlePubMedPMC
- 2. Krishnamurthi RV, Ikeda T, Feigin VL. Global, regional and country-specific burden of ischaemic stroke, intracerebral haemorrhage and subarachnoid haemorrhage: a systematic analysis of the Global Burden of Disease Study 2017. Neuroepidemiology 2020;54:171-179 https://doi.org/10.1159/000506396.ArticlePubMed
- 3. Thayabaranathan T, Kim J, Cadilhac DA, Thrift AG, Donnan GA, Howard G, et al. Global stroke statistics 2022. Int J Stroke 2022;17:946-956 https://doi.org/10.1177/17474930221123175.ArticlePubMedPMC
- 4. Jung YS, Kim YE, Park H, Oh IH, Jo MW, Ock M, et al. Measuring the burden of disease in Korea, 2008-2018. J Prev Med Public Health 2021;54:293-300 https://doi.org/10.3961/jpmph.21.478.ArticlePubMedPMC
- 5. Jee SH, Boulware LE, Guallar E, Suh I, Appel LJ, Miller ER 3rd. Direct, progressive association of cardiovascular risk factors with incident proteinuria: results from the Korea Medical Insurance Corporation (KMIC) study. Arch Intern Med 2005;165:2299-2304 https://doi.org/10.1001/archinte.165.19.2299.ArticlePubMed
- 6. Ebrahim S, Sung J, Song YM, Ferrer RL, Lawlor DA, Davey Smith G. Serum cholesterol, haemorrhagic stroke, ischaemic stroke, and myocardial infarction: Korean national health system prospective cohort study. BMJ 2006;333:22 https://doi.org/10.1136/bmj.38855.610324.80.ArticlePubMedPMC
- 7. Lee SU, Kim T, Kwon OK, Bang JS, Ban SP, Byoun HS, et al. Trends in the incidence and treatment of cerebrovascular diseases in Korea: part I. Intracranial aneurysm, intracerebral hemorrhage, and arteriovenous malformation. J Korean Neurosurg Soc 2020;63:56-68 https://doi.org/10.3340/jkns.2018.0179.ArticlePubMedPMC
- 8. Lee SU, Kim T, Kwon OK, Bang JS, Ban SP, Byoun HS, et al. Trends in the incidence and treatment of cerebrovascular diseases in Korea: part II. Cerebral infarction, cerebral arterial stenosis, and moyamoya disease. J Korean Neurosurg Soc 2020;63:69-79 https://doi.org/10.3340/jkns.2018.0182.ArticlePubMed
- 9. Seong SC, Kim YY, Khang YH, Park JH, Kang HJ, Lee H, et al. Data resource profile: the National Health Information Database of the National Health Insurance Service in South Korea. Int J Epidemiol 2017;46:799-800 https://doi.org/10.1093/ije/dyw253.ArticlePubMed
- 10. Cho M, Lee HH, Baek JH, Yum KS, Kim M, Bae JW, et al. Identification of acute myocardial infarction and stroke events using the National Health Insurance Service database. Epidemiol Health 2024;46:e2024001.ArticlePubMed
- 11. Sacco RL, Kasner SE, Broderick JP, Caplan LR, Connors JJ, Culebras A, et al. An updated definition of stroke for the 21st century: a statement for healthcare professionals from the American Heart Association/American Stroke Association. Stroke 2013;44:2064-2089 https://doi.org/10.1161/STR.0b013e318296aeca.ArticlePubMed
- 12. Kim JY, Kang K, Kang J, Koo J, Kim DH, Kim BJ, et al. Executive summary of stroke statistics in Korea 2018: a report from the Epidemiology Research Council of the Korean Stroke Society. J Stroke 2019;21:42-59 https://doi.org/10.5853/jos.2018.03125.ArticlePubMedPMC
- 13. Kim JY, Lee KJ, Kang J, Kim BJ, Han MK, Kim SE, et al. Development of stroke identification algorithm for claims data using the multicenter stroke registry database. PLoS One 2020;15:e0228997. https://doi.org/10.1371/journal.pone.0228997.ArticlePubMedPMC
- 14. Yang HS, Kim SY, Jo MJ, Kim YY, Park JH. Early-onset stroke among people with disabilities: a national database study in South Korea from 2008 to 2017. Lancet Reg Health West Pac 2023;38:100819 https://doi.org/10.1016/j.lanwpc.2023.100819.ArticlePubMedPMC
- 15. Li J, Imano H, Kitamura A, Kiyama M, Yamagishi K, Tanaka M, et al. Trends in the incidence of stroke and its subtypes from 1963 to 2018 in Japanese urban and rural communities: the Circulatory Risk in Communities Study (CIRCS). Int J Stroke 2023;18:657-662 https://doi.org/10.1177/17474930221135531.ArticlePubMed
- 16. Takashima N, Arima H, Turin TC, Nakamura Y, Sugihara H, Morita Y, et al. The 21-year trend of stroke incidence in a general Japanese population: results from the Takashima Stroke Registry, 1990-2010. Cerebrovasc Dis 2022;51:570-576 https://doi.org/10.1159/000521643.ArticlePubMed
- 17. Tsai CF, Wang YH, Teng NC, Yip PK, Chen LK. Incidence, subtypes, sex differences and trends of stroke in Taiwan. PLoS One 2022;17:e0277296. https://doi.org/10.1371/journal.pone.0277296.ArticlePubMedPMC
 PubReader
 ePub Link
 Cite
Cite


