Articles
- Page Path
- HOME > Epidemiol Health > Volume 45; 2023 > Article
-
COVID-19
Original Article
Effective vaccination strategies to control COVID-19 in Korea: a modeling study -
Youngsuk Ko1
 , Kyong Ran Peck2, Yae-Jean Kim3, Dong-Hyun Kim4, Eunok Jung1
 -
Epidemiol Health 2023;45:e2023084.
DOI: https://doi.org/10.4178/epih.e2023084
Published online: September 7, 2023
1Department of Mathematics, Konkuk University, Seoul, Korea
2Division of Infectious Diseases, Department of Medicine, Samsung Medical Center, Sungkyunkwan University School of Medicine, Seoul, Korea
3Department of Pediatrics, Samsung Medical Center, Sungkyunkwan University School of Medicine, Seoul, Korea
4Department of Social and Preventive Medicine, Hallym University College of Medicine, Chuncheon, Korea
- Correspondence: Eunok Jung Department of Mathematics, Konkuk University, 120 Neungdong-ro, Gwangjin-gu, Seoul 05029, Korea E-mail: junge@konkuk.ac.kr
© 2023, Korean Society of Epidemiology
This is an open-access article distributed under the terms of the Creative Commons Attribution License (http://creativecommons.org/licenses/by/4.0/), which permits unrestricted use, distribution, and reproduction in any medium, provided the original work is properly cited.
- 5,690 Views
- 128 Download
Abstract
-
OBJECTIVES
- In Korea, as immunity levels of the coronavirus disease 2019 (COVID-19) in the population acquired through previous infections and vaccinations have decreased, booster vaccinations have emerged as a necessary measure to control new outbreaks. The objective of this study was to identify the most suitable vaccination strategy for controlling the surge in COVID-19 cases.
-
METHODS
- A mathematical model was developed to concurrently evaluate the immunity levels induced by vaccines and infections. This model was then employed to investigate the potential for future resurgence and the possibility of control through the use of vaccines and antivirals.
-
RESULTS
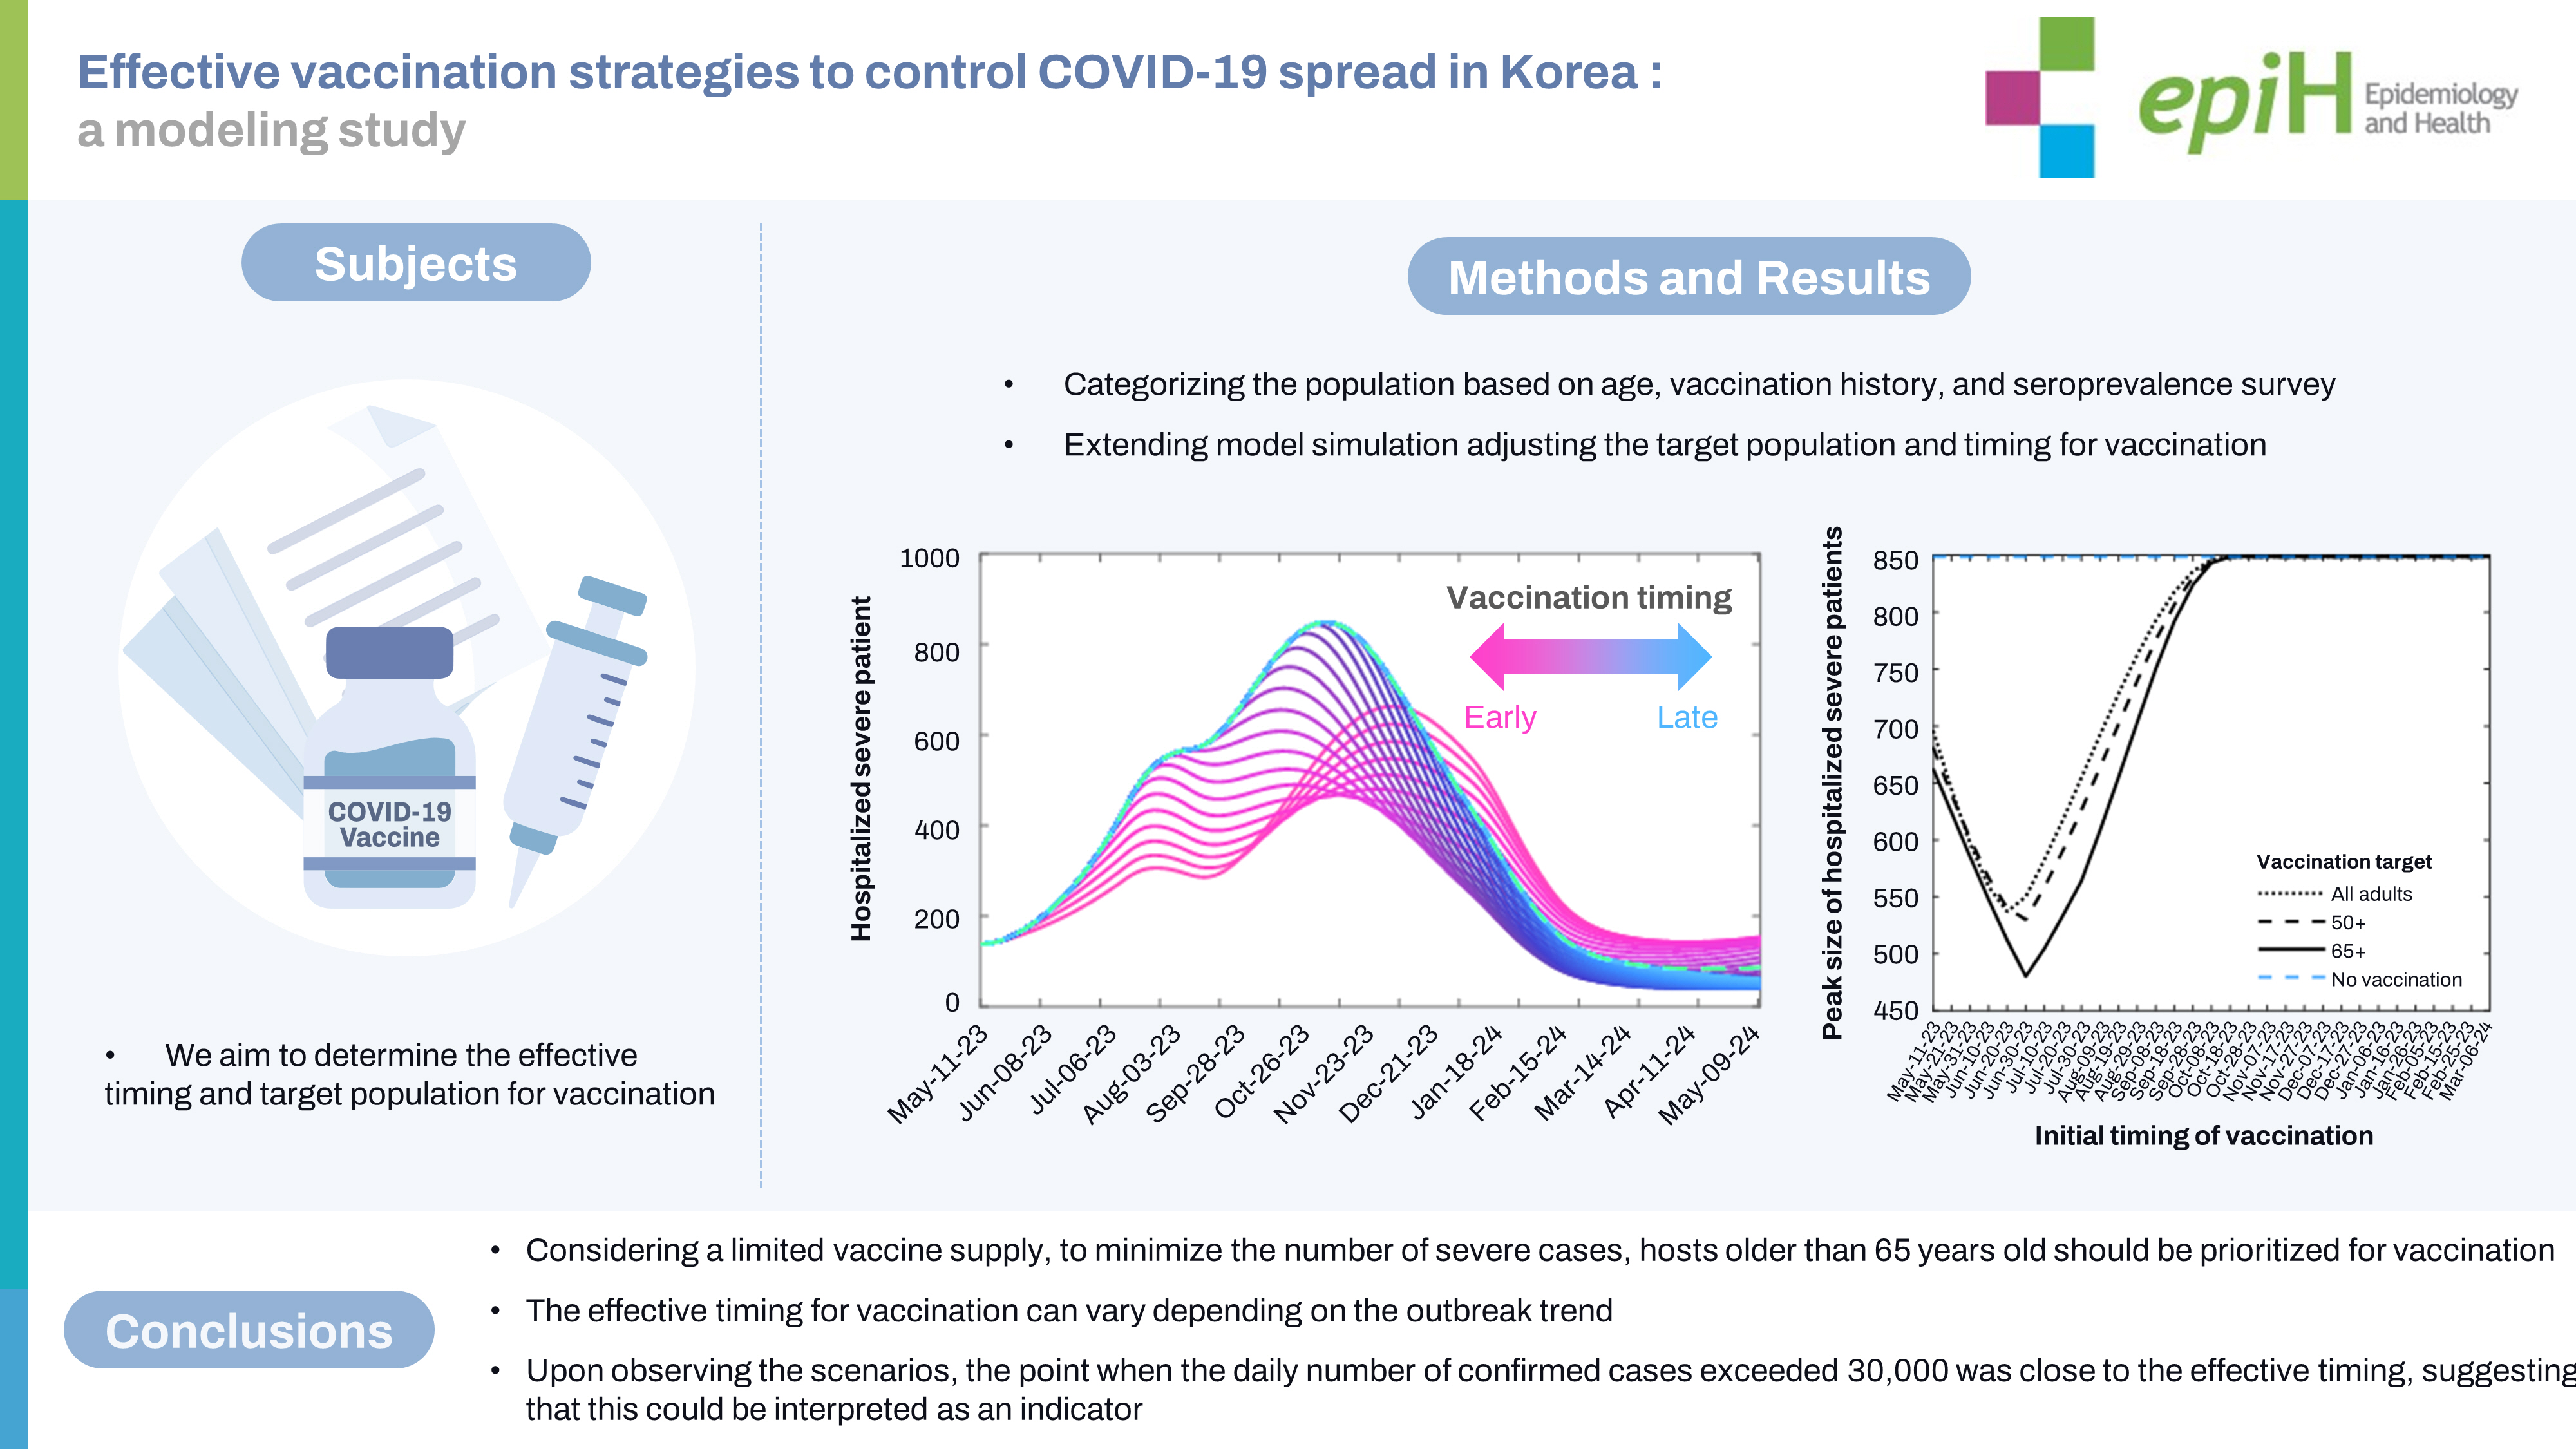
- As of May 11, 2023, if the current epidemic trend persists without further vaccination efforts, a peak in resurgence is anticipated to occur around mid-October of the same year. Under the most favorable circumstances, the peak number of severely hospitalized patients could be reduced by 43% (n=480) compared to the scenario without vaccine intervention (n=849). Depending on outbreak trends and vaccination strategies, the best timing for vaccination in terms of minimizing this peak varies from May 2023 to August 2023.
-
CONCLUSIONS
- Our findings suggest that if the epidemic persist, the best timing for administering vaccinations would need to be earlier than currently outlined in the Korean plan. It is imperative to continue monitoring outbreak trends, as this is key to determining the best vaccination timing in order to manage potential future surges.
- Since the Omicron wave of coronavirus disease 2019 (COVID-19) in early 2022, the Korean government has progressively eased non-pharmaceutical interventions (NPIs). The national social distancing strategy was officially discontinued on April 18 of the same year [1]. Additionally, the mandate to wear masks in outdoor settings was modified to a recommendation on September 26, 2022. The policy on indoor mask-wearing was similarly relaxed on January 1, 2023, apart from public transportation and hospitals. The requirement for mask-wearing on public transportation was later lifted on March 20, 2023 [2-4]. This left the mask mandate for hospitals as the only remaining NPI in effect in Korea. As of May 2023, approximately 20,000 cases are confirmed and 200 severely ill patients are admitted to hospitals in Korea daily [5]. The pursuit of a maximally effective vaccination strategy is crucial, as COVID-19 should ideally be manageable as a respiratory tract infection using medical tools, without the need to reimpose NPIs unless more virulent variants emerge in the future.
- Mathematical modeling serves as a valuable instrument for formulating intervention strategies and predictions. As such, numerous models have been developed to offer scientific insights into vaccination strategies. Since the commencement of vaccinations in early 2021, research has been conducted on prioritization based on factors such as age group, region, and risk level. Ko et al. [6] devised a mathematical model that takes into account age group, yielding an age-based vaccine prioritization strategy that varies depending on the outbreak situation. Matrajt et al. [7] proposed that vaccination priority should be given to individuals who are at high risk of severe disease or death. Similarly, Bubar et al. [8] evaluated the effectiveness of various vaccine prioritization strategies, taking serostatus into consideration. Moore et al. [9] determined that the most effective strategy for controlling the spread of COVID-19 was to combine vaccination with NPIs. In the wake of the 2023 Omicron wave, Are et al. [10] discussed how the long-term burden and dynamics of COVID-19 may be influenced by waning immunity and the emergence of new variants, considering various factors. However, their model did not account for residual immunity against disease severity induced by natural infection.
- On March 22, 2023, the Korean government transitioned to an annual vaccination schedule and declared that vaccinations would commence between October and November of 2023 [11]. The immunity conferred by vaccines and infections can diminish over time, potentially triggering an epidemic wave [12]. The question of “Who should be vaccinated, and when is the best time?” is a relevant issue, as is the anticipation of future surges. In this paper, we explore effective vaccination strategies for managing COVID-19 surges using a sophisticated mathematical model. Our model, which is based on publicly available data and a national antibody survey, provides a detailed understanding of immunity levels, depending on whether an individual has been vaccinated or infected.
INTRODUCTION
- Mathematical modeling of COVID-19 considering immunity induced by vaccine or infection
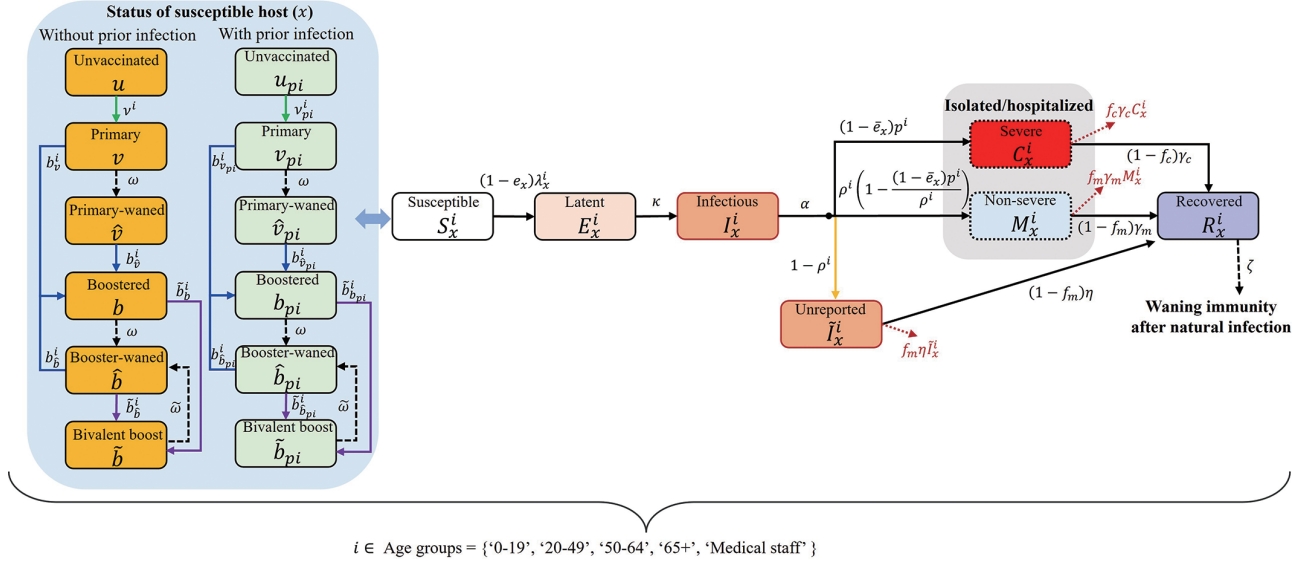
- In this study, the population was divided into 5 groups: those aged 0-19 years (I), 20-49 years (II), 50-64 years (III), and 65 years and older (IV), as well as medical personnel (V). Individuals within these groups were further classified based on their vaccination status. The categories were as follows: unvaccinated, received primary vaccination less than 6 months ago, received primary vaccination 6 or more months ago, received booster vaccination (including third and more doses) less than 6 months ago, received booster vaccination (including the bivariant vaccine) 6 or more months ago, and received the bivariant vaccine less than 6 months ago. Finally, these individuals were additionally categorized based on their prior infection status. Our model, represented as a flowchart in Figure 1, considers population-level immunity, unreported cases, and patients with severe disease. The subscript (x) of the classes S, E, I, C, M, R,
- The transmission matrix for age groups includes various settings such as households, schools, workplaces, hospitals, and other locations [13,14]. This matrix also incorporates statistical data on outpatient and inpatient patients categorized by age group, along with the presumed number of contacts for outpatients (1 each for doctors and nurses) and inpatients (2 for doctors and 3 for nurses). Given that the patterns of contact and transmission in workplaces, schools, and other venues may fluctuate over time, the generalized formula for the elements constituting the transmission matrix is articulated as follows:
- where h represents the probability of infection through household contact; δi denotes the age-dependent relative susceptibility compared to those aged 0-19 years (i.e., δⅠ = 1) considering clinical susceptibility and other factors, such as compliance with policy or behavior; and q2, q3, q4, and q5 indicate relative risks of infection through contacts at work, other venues, schools, and hospitals, respectively. We assumed that the risk of infection through contact in school was the same as that in households—that is, q4= 1. However, this was considered to be influenced by the transmission rate adjusting factor s(t), estimated every 4 weeks to fit the data, as well as the school operation factor g(t), deemed to be 0 during vacation periods and 1 otherwise. In other words, contact in school is assumed to be non-existent during vacation periods. The relative risks associated with work-related and miscellaneous contacts—q2 and q3—were both set to 0.30, while q5 was set to 0.06, reflecting the effectiveness of hospital mask policies [15-17]. The force of infection is reduced by 1−ex if the susceptible host has been vaccinated and/or infected previously. Similarly, the corresponding severity rate is reduced by 1−
- To establish the initial conditions for this mathematical model, we considered groups of individuals with and without previous infections, segmented by vaccination history. This was based on vaccination statistics and the findings of the second Korean national antibody survey, which included the N-antibody positive rate, conducted in mid-December [18]. During this process, we adjusted the population with prior infection to account for the effects of vaccination. Consider a situation in which the vaccine effectiveness is 50%, and for every 100 individuals with prior infection, 100 are vaccinated and 50 unvaccinated. In this case, the number of vaccinated individuals with prior infection is 25 (50× 100× 0.5÷(100× 0.5+50)= 25), while the number of unvaccinated individuals previously infected is also 25 (50× 50÷(100× 0.5+50)= 25). In this study, we assumed that half of the population with previous infections belonged to Ri x and retained full immunity.
- Vaccination time-dependent forecast scenario design
- We conducted a simulation of COVID-19 outbreaks in Korea, extending to the situation at the time of this research, for the purpose of parameter estimation. Following this, we extended the simulation for an additional year, starting from May 11, 2023, to determine the best timing for vaccination. To establish the quantity of vaccines needed, we referred to the number of doses administered during the winter vaccination period at the end of 2022, which was approximately 6.6 million doses over 100 days [19]. We then established that 5 million doses of the bivalent vaccine would be administered over the course of 100 days, a figure that is lower than the results from the previous winter vaccination period. We created various scenarios by adjusting the target groups for vaccination, the number of extra doses, and the trends of the outbreak. The vaccination timing was set to begin on the start date of the model simulation extension (May 11, 2023) and to continue for 300 days thereafter (until March 6, 2024), with 10-day intervals. During the extension period, we incorporated the use of antiviral medications, with the default settings assuming these would be prescribed to 40% of patients over the age of 50 years. The application of antiviral drugs resulted in a 51% reduction in the number of severe cases [20].
- Ethics statement
- The study was conducted according to the guidelines of the Declaration of Helsinki, and approved by the Institutional Review Board of Konkuk University (7001355-202101-E-130).
MATERIALS AND METHODS
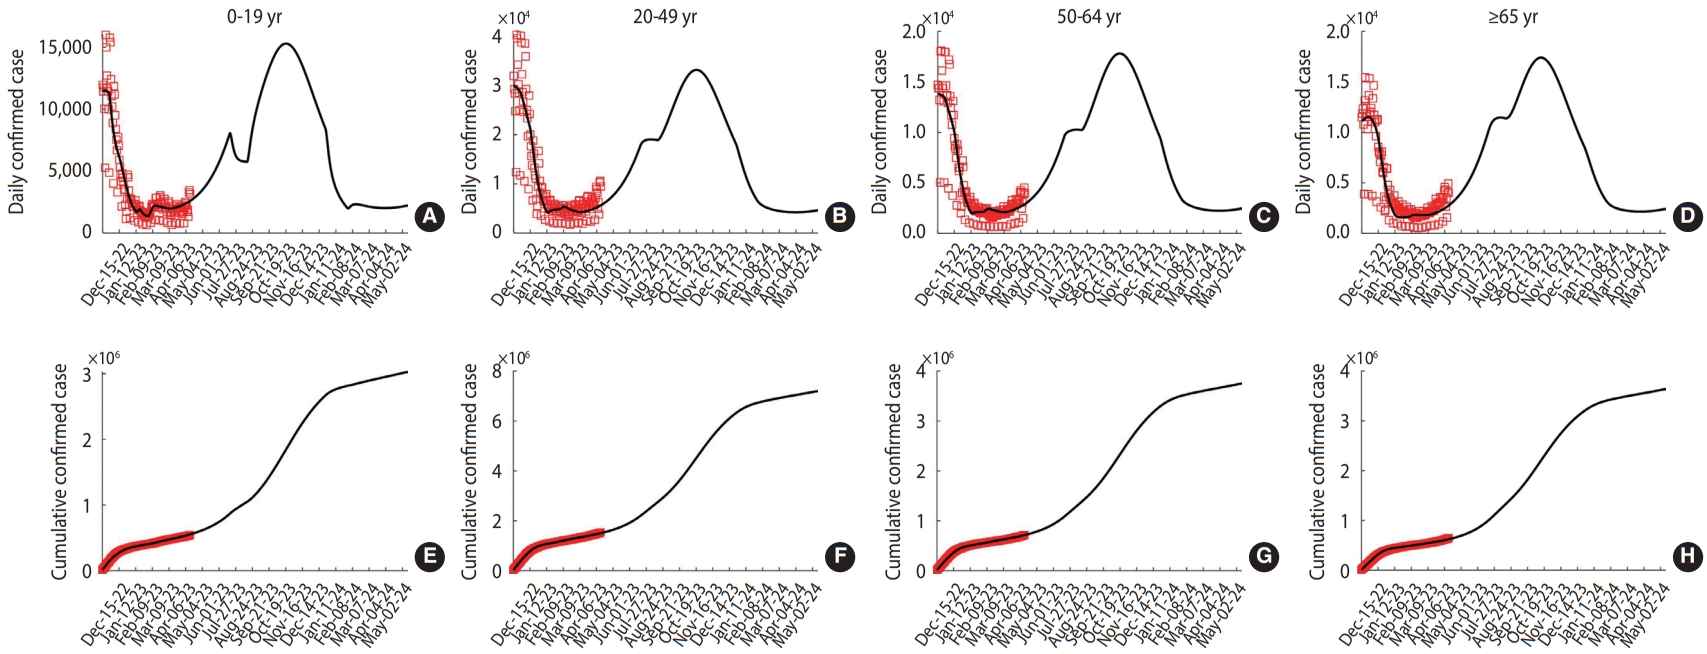
- The values and distributions of the estimated parameters can be found in the Supplementary Material 2. The transmission rate adjusting factor s(t) was considered to fluctuate cyclically at 4-week intervals, with values of 0.49, 0.19, 0.82, 0.50, and 0.57. The results of the model simulation, which include data fitting and the 1-year extension, are presented in Figure 2. For the extension, the transmission rate adjusting factor was applied from April 6, 2023 to May 11, 2023, during which time no vaccinations or antiviral medications were administered. The next peak is projected to occur in mid-October 2023. Notably, the sudden decrease observed in the underage group in July can be attributed to the summer vacation period.
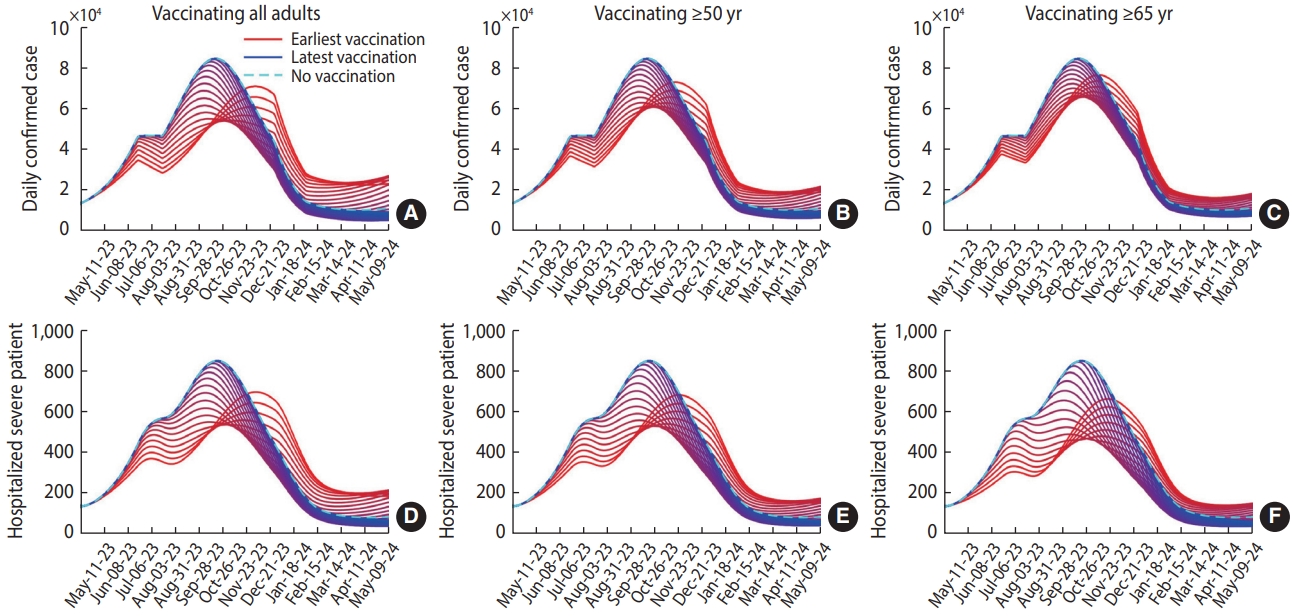
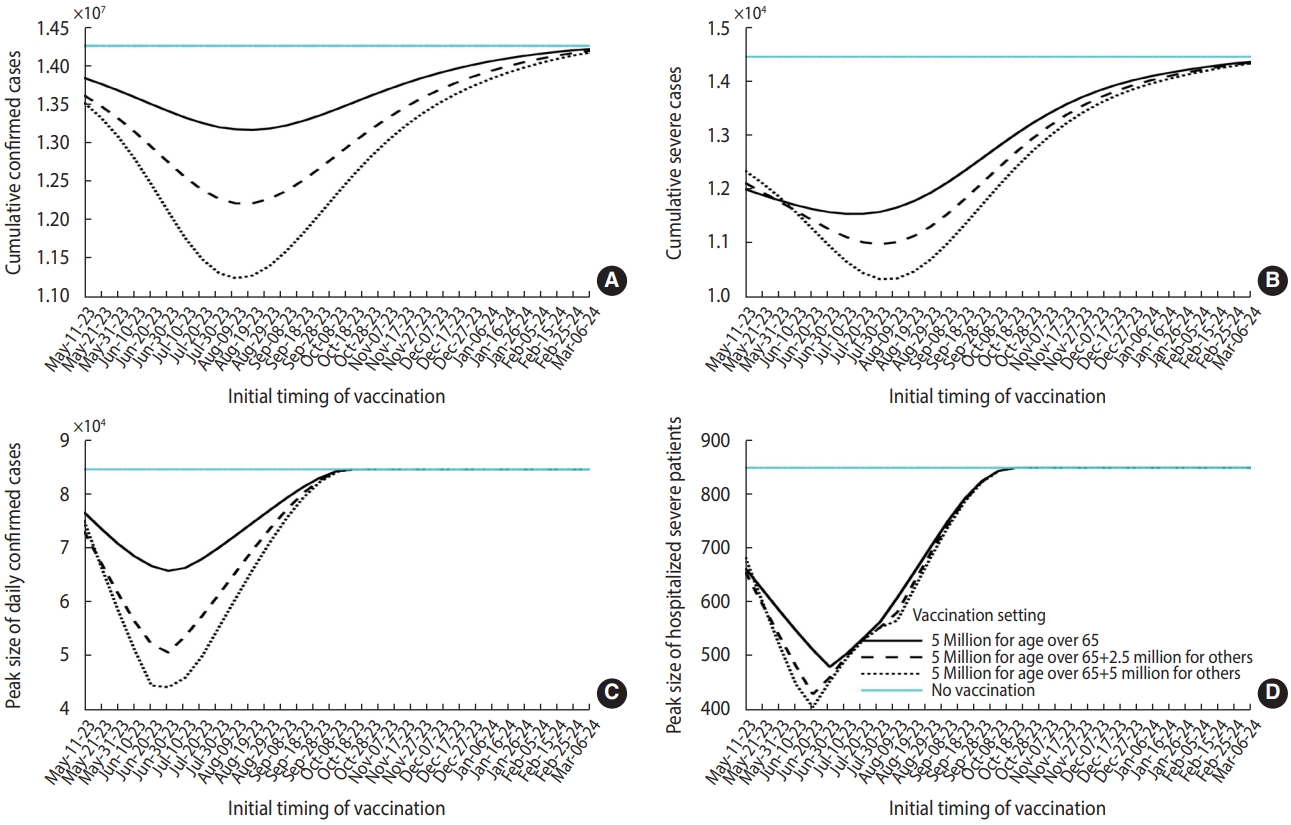
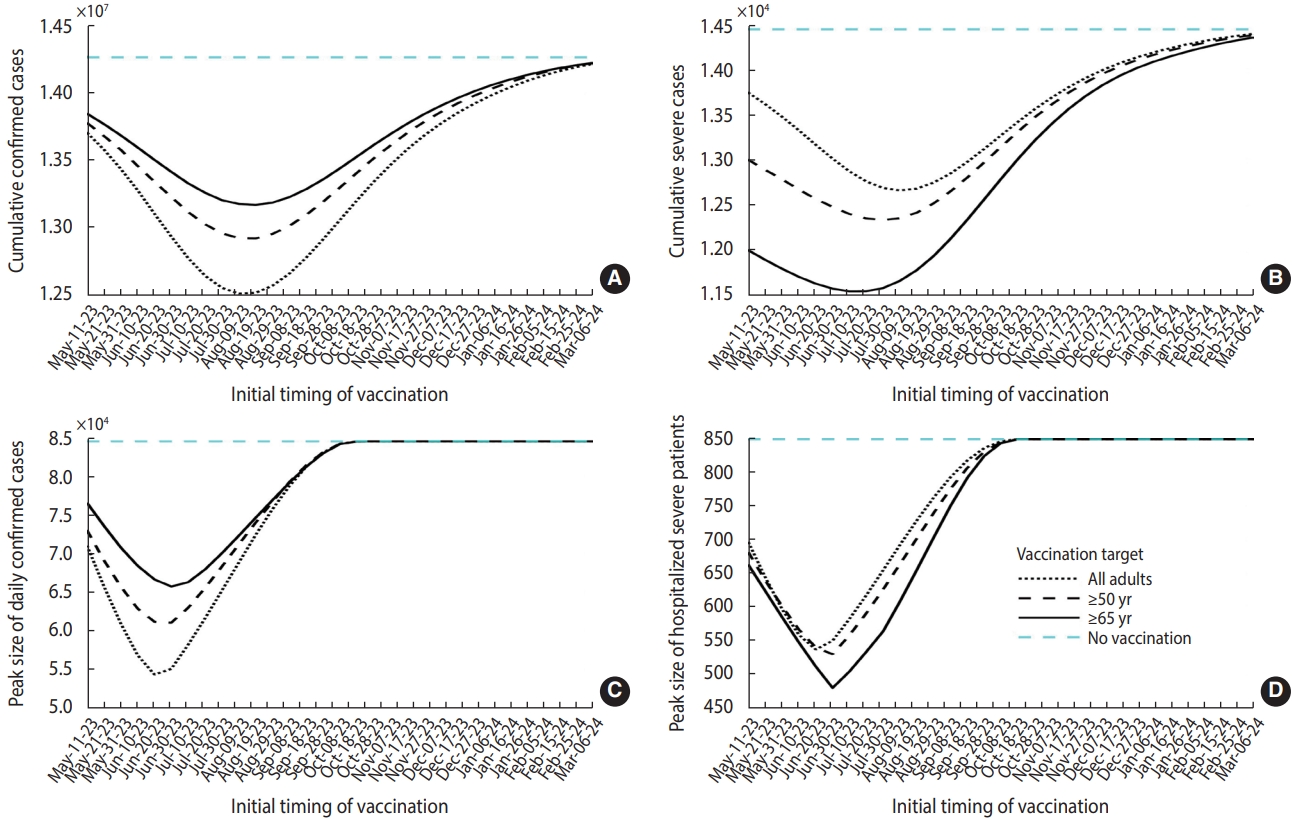
- Figure 3 presents the simulation results, which reflect various vaccination target settings. The peak of the outbreak can be delayed from mid-October 2023 to mid-November 2023 if a vaccination program is initiated earlier. When all adults were targeted for vaccination, both the daily and cumulative case numbers were lower. However, preferentially vaccinating the elderly resulted in fewer severe cases. Figure 4 summarizes the projected outbreak based on the initial timing of vaccination. If vaccination begins at the end of May, targeting individuals over 65 years of age (at a time when approximately 30,000 daily confirmed cases are expected), the peak number of severe patients requiring hospitalization could be reduced to 480. Table 1 displays the vaccination schedules expected to minimize either the cumulative or peak number of cases (or the number of patients requiring hospitalization due to severe symptoms). It also includes the predicted outbreak outcomes based on different scenario characteristics.
- Our findings indicated that vaccination strategies targeting individuals over 65 years old minimize the number of severe cases. Consequently, we conducted a supplementary scenario-based study, in which we fixed the number of vaccine doses for the over-65 age group at 5 million and retained the current outbreak trend. However, we varied the additional doses for other adult groups between 2.5 million and 5 million (Figure 5). As the number of extra doses increased, both the cumulative and peak numbers of severe patients were minimized, provided that vaccination commenced at the best time. These additional benefits were diminished if vaccination was initiated earlier or later than the best time point.
- When additional analyses were performed for scenarios involving varying numbers of individuals over the age of 65 years receiving vaccinations, the best timing for vaccination differed. Specifically, the best dates were August 9 for 2.5 million individuals and May 31 for 7.5 million individuals, even when assuming the same outbreak trend (Table 1). Supplementary Material 3 provides a description of the sensitivity analysis of fundamental parameters in the extended simulation. This analysis is crucial due to the potential emergence of new variants and future changes in NPIs.
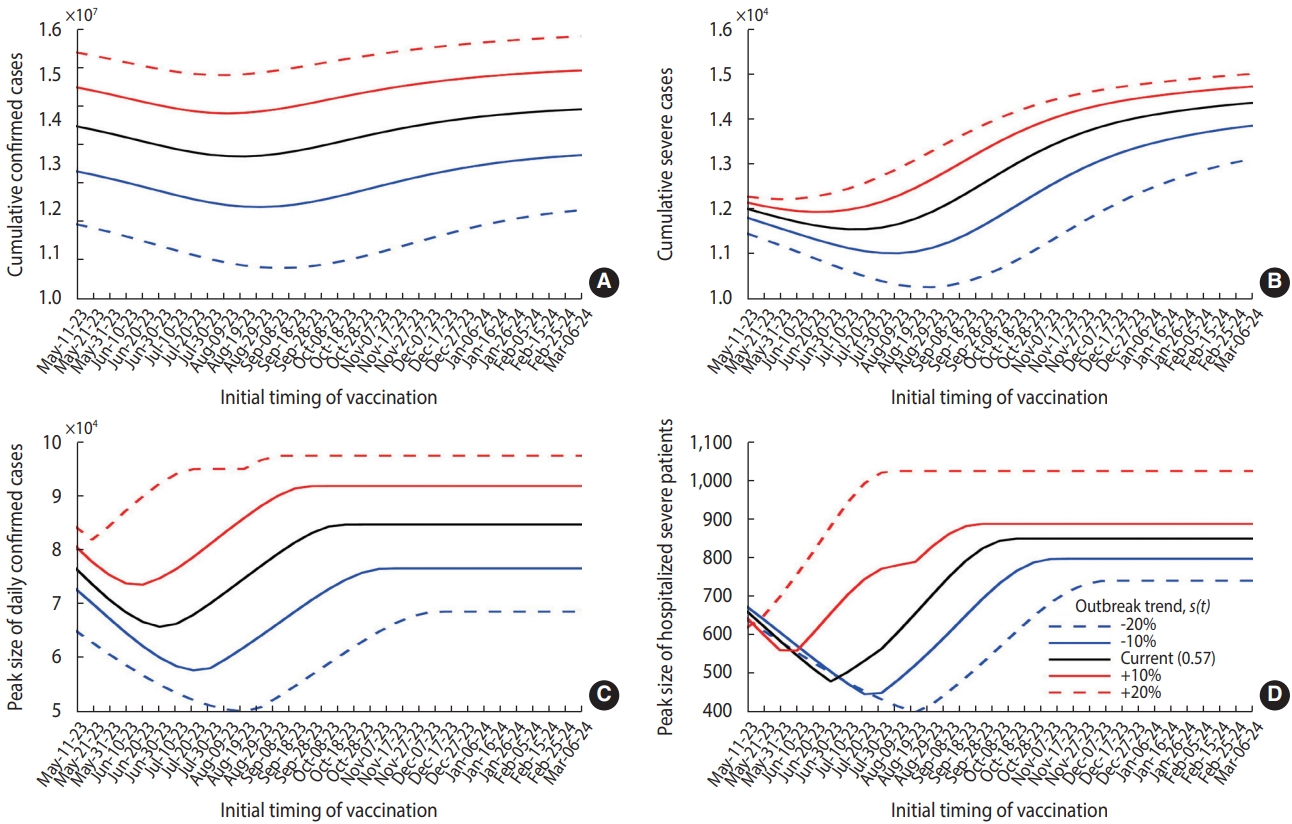
- In this study, we set the vaccination count at 5 million for individuals aged over 65 years, as depicted by the solid curves in Figure 6, and extrapolated the simulation results to various outbreak trends, represented by s(t) in the model. The best timing to minimize the cumulative or peak numbers of cases and severe hospitalizations may be postponed if s(t) decreases. Conversely, if s(t) increases, vaccination should commence earlier. For instance, if s(t) decreases by 20%, the ideal initiation time for vaccination to minimize the peak number of severe patients is delayed from June 30, 2023 to August 19, 2023.
RESULTS
- As the complexity of the mathematical model increases, aggregating the necessary data features becomes increasingly challenging. Moreover, if crucial parameters are assumed or estimated, overfitting could result in erroneous decisions or predictions [21,22]. In this study, we constructed a sophisticated model with parameters and initial conditions that were precisely determined based on data. We took into account hosts who had experienced infection prior to the initial time point, with the Korean antibody survey assisting in establishing the initial conditions of the system ordinary differential equations [18].
- As of May 11, 2023, should the current trend continue without further vaccination efforts, the peak of the next wave is predicted to occur in mid-October. The number of severe cases requiring hospitalization could potentially surpass 800. At present, the number of intensive care unit beds designated for COVID-19 patients in Korea stands at 249, a figure that falls short of the anticipated peak demand [23]. Our findings underscore the necessity to adequately equip medical resources in preparation for the forthcoming wave. They also indicate that the impending wave could be handled without resorting to NPIs.
- Our simulation results suggest that the best timing of vaccination is earlier than currently outlined in the Korean governmental plan. We discovered that the peak number of severe hospitalizations was minimized when the initial vaccination period fell between May and August, depending on the trend of the outbreak [11]. In the extended simulation results, which were based on the current outbreak trend, we found that the peak was minimized when initial vaccination occurred at the end of June. On the same day as that ideal date of vaccine initiation, the number of daily confirmed cases is projected to reach approximately 30,000, indicating the early phase of a resurgence. However, determining the best timing for vaccination is challenging due to the increasing number of cases, as the outbreak trend is sensitive to changes in key parameters. Therefore, it is crucial to compare future trends with model simulation results to establish effective vaccination scheduling. By considering varying outbreak trends, our model can assist in determining the ideal timing for vaccine administration.
- Clearly, an increase in the scale of vaccination leads to a decrease in the scale of the outbreak. However, our observations indicate that hastily implemented large-scale vaccination does not yield a significant effect when compared to a scenario involving lower doses, as shown in panels (B) and (D) of Figure 5. This is because the immunity conferred by vaccination diminishes more rapidly than that induced by natural infection. In a similar vein, we noted that the best timing for vaccination varies in relation to the dosage of the vaccine, as indicated in Table 1, given a consistent outbreak trend. Consequently, the timing of vaccination should be optimized based not only on the outbreak trend, but also on the anticipated scale of vaccination.
- The limitations of this study were as follows. First, the contact matrix was established based on data collected prior to the COVID-19 pandemic. Consequently, it may not accurately reflect current conditions due to alterations in population behaviors or lifestyle patterns that have occurred since the outbreak. Second, while the proportion of the population reporting or self-isolating may have changed after December 2022, this information was incorporated into the model using the same values as before. Finally, we did not consider new variants or relaxations in policy that could potentially alter outbreak trends for this prediction. The actual progression of resurgence may deviate from the prediction due to modifications in control strategies for COVID-19 that have been implemented since early June 2023. The results of the sensitivity analysis, found in the Supplementary Material 3, highlight the uncertainty caused by potential changes in key parameters.
DISCUSSION
SUPPLEMENTARY MATERIALS
Supplementary Material 1.
Supplementary Material 2
-
CONFLICT OF INTEREST
The authors have no conflicts of interest to declare for this study.
-
FUNDING
This paper is supported by the Korea National Research Foundation (NRF) grant funded by the Korean government (MEST) (NRF-2021M3E5E308120711). This paper is also supported by the Korea National Research Foundation (NRF) grant funded by the Korean government (MEST) (NRF-2021R1A2C100448711).
-
AUTHOR CONTRIBUTIONS
Conceptualization: Ko Y, Jung E. Data curation: Ko Y, Kim DH. Formal analysis: Ko Y, Peck KR, Kim YJ, Kim DH, Jung E. Funding acquisition: Jung E, Kim DH. Methodology: Ko Y, Jung E. Project administration: Jung E, Kim DH. Visualization: Ko Y. Writing – original draft: Ko Y, Peck KR, Jung E. Writing – review & editing: Ko Y, Peck KR, Kim YJ, Kim DH, Jung E.
NOTES
ACKNOWLEDGEMENTS


- 1. Seoul Metropolitan Government. Back to normal life, complete lifting of social distancing measures from April 18; 2022 Jul 11 [cited 2023 Jun 15]. Available from: https://news.seoul.go.kr/welfare/archives/542308 (Korean, author’s translation).
- 2. Korea Disease Control and Prevention Agency. Lifting of mandatory outdoor mask wearing and recommendation of voluntary wearing; 2022 Sep 30 [cited 2023 Jun 15]. Available from: https://www.kdca.go.kr/gallery.es?mid=a20503010000&bid =0002&list_no=145857&act=view (Korean, author’s translation).
- 3. Korea Disease Control and Prevention Agency. Where should I wear a mask indoors?; 2023 Jan 31 [cited 2023 Jun 15]. Available from: https://www.kdca.go.kr/board/board.es?mid=a20501050000&bid=0015&act=view&list_no=721800 (Korean, author’s translation).
- 4. Korea Disease Control and Prevention Agency. Mandatory mask wearing on public transportation will be lifted from the April 20; 2023 Mar 20 [cited 2023 Jun 15]. Available from: https://www.korea.kr/multi/visualNewsView.do?newsId=148912938 (Korean, author’s translation).
- 5. Korea Disease Control and Prevention Agency. Domestic occurrence status of COVID-19 [cited 2023 Jun 15]. Available from: https://ncov.kdca.go.kr/bdBoardList_Real.do?brdId=1&brdGubun=11&ncvContSeq=&contSeq=&board_id=&gubun= (Korean, author’s translation).
- 6. Ko Y, Lee J, Seo Y, Jung E. Risk of COVID-19 transmission in heterogeneous age groups and effective vaccination strategy in Korea: a mathematical modeling study. Epidemiol Health 2021;43:e2021059.ArticlePubMedPMC
- 7. Matrajt L, Eaton J, Leung T, Brown ER. Vaccine optimization for COVID-19: who to vaccinate first? Sci Adv 2021;7:eabf1374.ArticlePubMedPMC
- 8. Bubar KM, Reinholt K, Kissler SM, Lipsitch M, Cobey S, Grad YH, et al. Model-informed COVID-19 vaccine prioritization strategies by age and serostatus. Science 2021;371:916-921.ArticlePubMedPMC
- 9. Moore S, Hill EM, Tildesley MJ, Dyson L, Keeling MJ. Vaccination and non-pharmaceutical interventions for COVID-19: a mathematical modelling study. Lancet Infect Dis 2021;21:793-802.ArticlePubMedPMC
- 10. Are EB, Song Y, Stockdale JE, Tupper P, Colijn C. COVID-19 endgame: from pandemic to endemic? Vaccination, reopening and evolution in low- and high-vaccinated populations. J Theor Biol 2023;559:111368.ArticlePubMedPMC
- 11. Korea Disease Control and Prevention Agency. COVID-19 vaccine, switching to once a year vaccination; 2023 Mar 22 [cited 2023 Jun 15]. Available from: https://ncov.kdca.go.kr/tcmBoardView.do?gubun=BDJ&brdId =3&brdGubun=31&dataGubun=&ncvContSeq=7216&board_id=312&contSeq=7216 (Korean, author’s translation).
- 12. Goldberg Y, Mandel M, Bar-On YM, Bodenheimer O, Freedman L, Haas EJ, et al. Waning immunity after the BNT162b2 vaccine in Israel. N Engl J Med 2021;385:e85.ArticlePubMedPMC
- 13. Prem K, Cook AR, Jit M. Projecting social contact matrices in 152 countries using contact surveys and demographic data. PLoS Comput Biol 2017;13:e1005697.ArticlePubMedPMC
- 14. Korean Statistical Information Service. National health care statistics: number of inpatients by patient residence, gender, and age [cited 2023 Jun 15]. Available from: https://kosis.kr/statHtml/statHtml.do?orgId=117&tblId=DT_117049_A055&conn_path=I2 (Korean, author’s translation).
- 15. Zee ST, Kwok LF, Kee KM, Fung LH, Luk WP, Chan TL, et al. Impact of COVID-19 vaccination on healthcare worker infection rate and outcome during SARS-CoV-2 Omicron variant outbreak in Hong Kong. Vaccines (Basel) 2022;10:1322.ArticlePubMedPMC
- 16. Cheng HY, Jian SW, Liu DP, Ng TC, Huang WT, Lin HH, et al. Contact tracing assessment of COVID-19 transmission dynamics in Taiwan and risk at different exposure periods before and after symptom onset. JAMA Intern Med 2020;180:1156-1163.ArticlePubMedPMC
- 17. Payne DC, Smith-Jeffcoat SE, Nowak G, Chukwuma U, Geibe JR, Hawkins RJ, et al. SARS-CoV-2 infections and serologic responses from a sample of U.S. Navy service members - USS Theodore Roosevelt, April 2020. MMWR Morb Mortal Wkly Rep 2020;69:714-721.ArticlePubMedPMC
- 18. Korea Disease Control and Prevention Agency. Announcement of the results of the second survey on the positive rate of COVID19 antibodies; 2023 Jan 18 [cited 2023 Jun 15]. Available from: https://www.kdca.go.kr/gallery.es?mid=a20503010000&bid=0002&list_no=145991&act=view (Korean, author’s translation).
- 19. Korea Disease Control and Prevention Agency. Daily vaccination status [cited 2023 Jun 15]. Available from: https://ncv.kdca.go.kr/vaccineStatus.es?mid=a11710000000 (Korean, author’s translation).
- 20. Jeon J, Chin B. Treatment options for patients with mild-to-moderate coronavirus disease 2019 in Korea. J Korean Med Sci 2022;37:e352.ArticlePubMedPMCPDF
- 21. Basu S, Andrews J. Complexity in mathematical models of public health policies: a guide for consumers of models. PLoS Med 2013;10:e1001540.ArticlePubMedPMC
- 22. James LP, Salomon JA, Buckee CO, Menzies NA. The use and misuse of mathematical modeling for infectious disease policymaking: lessons for the COVID-19 pandemic. Med Decis Making 2021;41:379-385.ArticlePubMedPMCPDF
- 23. Korea Disease Control and Prevention Agency. Overall status of COVID-19 in Korea [cited 2023 Jun 15]. Available from: https://ncov.kdca.go.kr/bdBoardListR.do?brdId=1&brdGubun=11 (Korean, author’s translation).
 PubReader
 ePub Link
 Cite
Cite