Articles
- Page Path
- HOME > Epidemiol Health > Volume 45; 2023 > Article
-
Original Article
No association between genetically predicted C-reactive protein levels and colorectal cancer survival in Korean: two-sample Mendelian randomization analysis -
Chang Kyun Choi1*
 , Jung-Ho Yang1, Min-Ho Shin1, Sang-Hee Cho2, Sun-Seog Kweon1
 -
Epidemiol Health 2023;45:e2023039.
DOI: https://doi.org/10.4178/epih.e2023039
Published online: March 22, 2023
1Department of Preventive Medicine, Chonnam National University Medical School, Hwasun, Korea
2Department of Hematology-Oncology, Chonnam National University Hwasun Hospital, Hwasun, Korea
- Correspondence: Sun-Seog Kweon Department of Preventive Medicine, Chonnam National University Medical School, 264 Seoyang-ro, Hwasun-eup, Hwasun 58128, Korea E-mail: ujingogo@paran.com
- *Current affiliation: Division of Cancer Registration and Surveillance, National Cancer Control Institute, National Cancer Center, Goyang, Korea.
© 2023, Korean Society of Epidemiology
This is an open-access article distributed under the terms of the Creative Commons Attribution License (http://creativecommons.org/licenses/by/4.0/), which permits unrestricted use, distribution, and reproduction in any medium, provided the original work is properly cited.
- 4,464 Views
- 165 Download
Abstract
-
OBJECTIVES
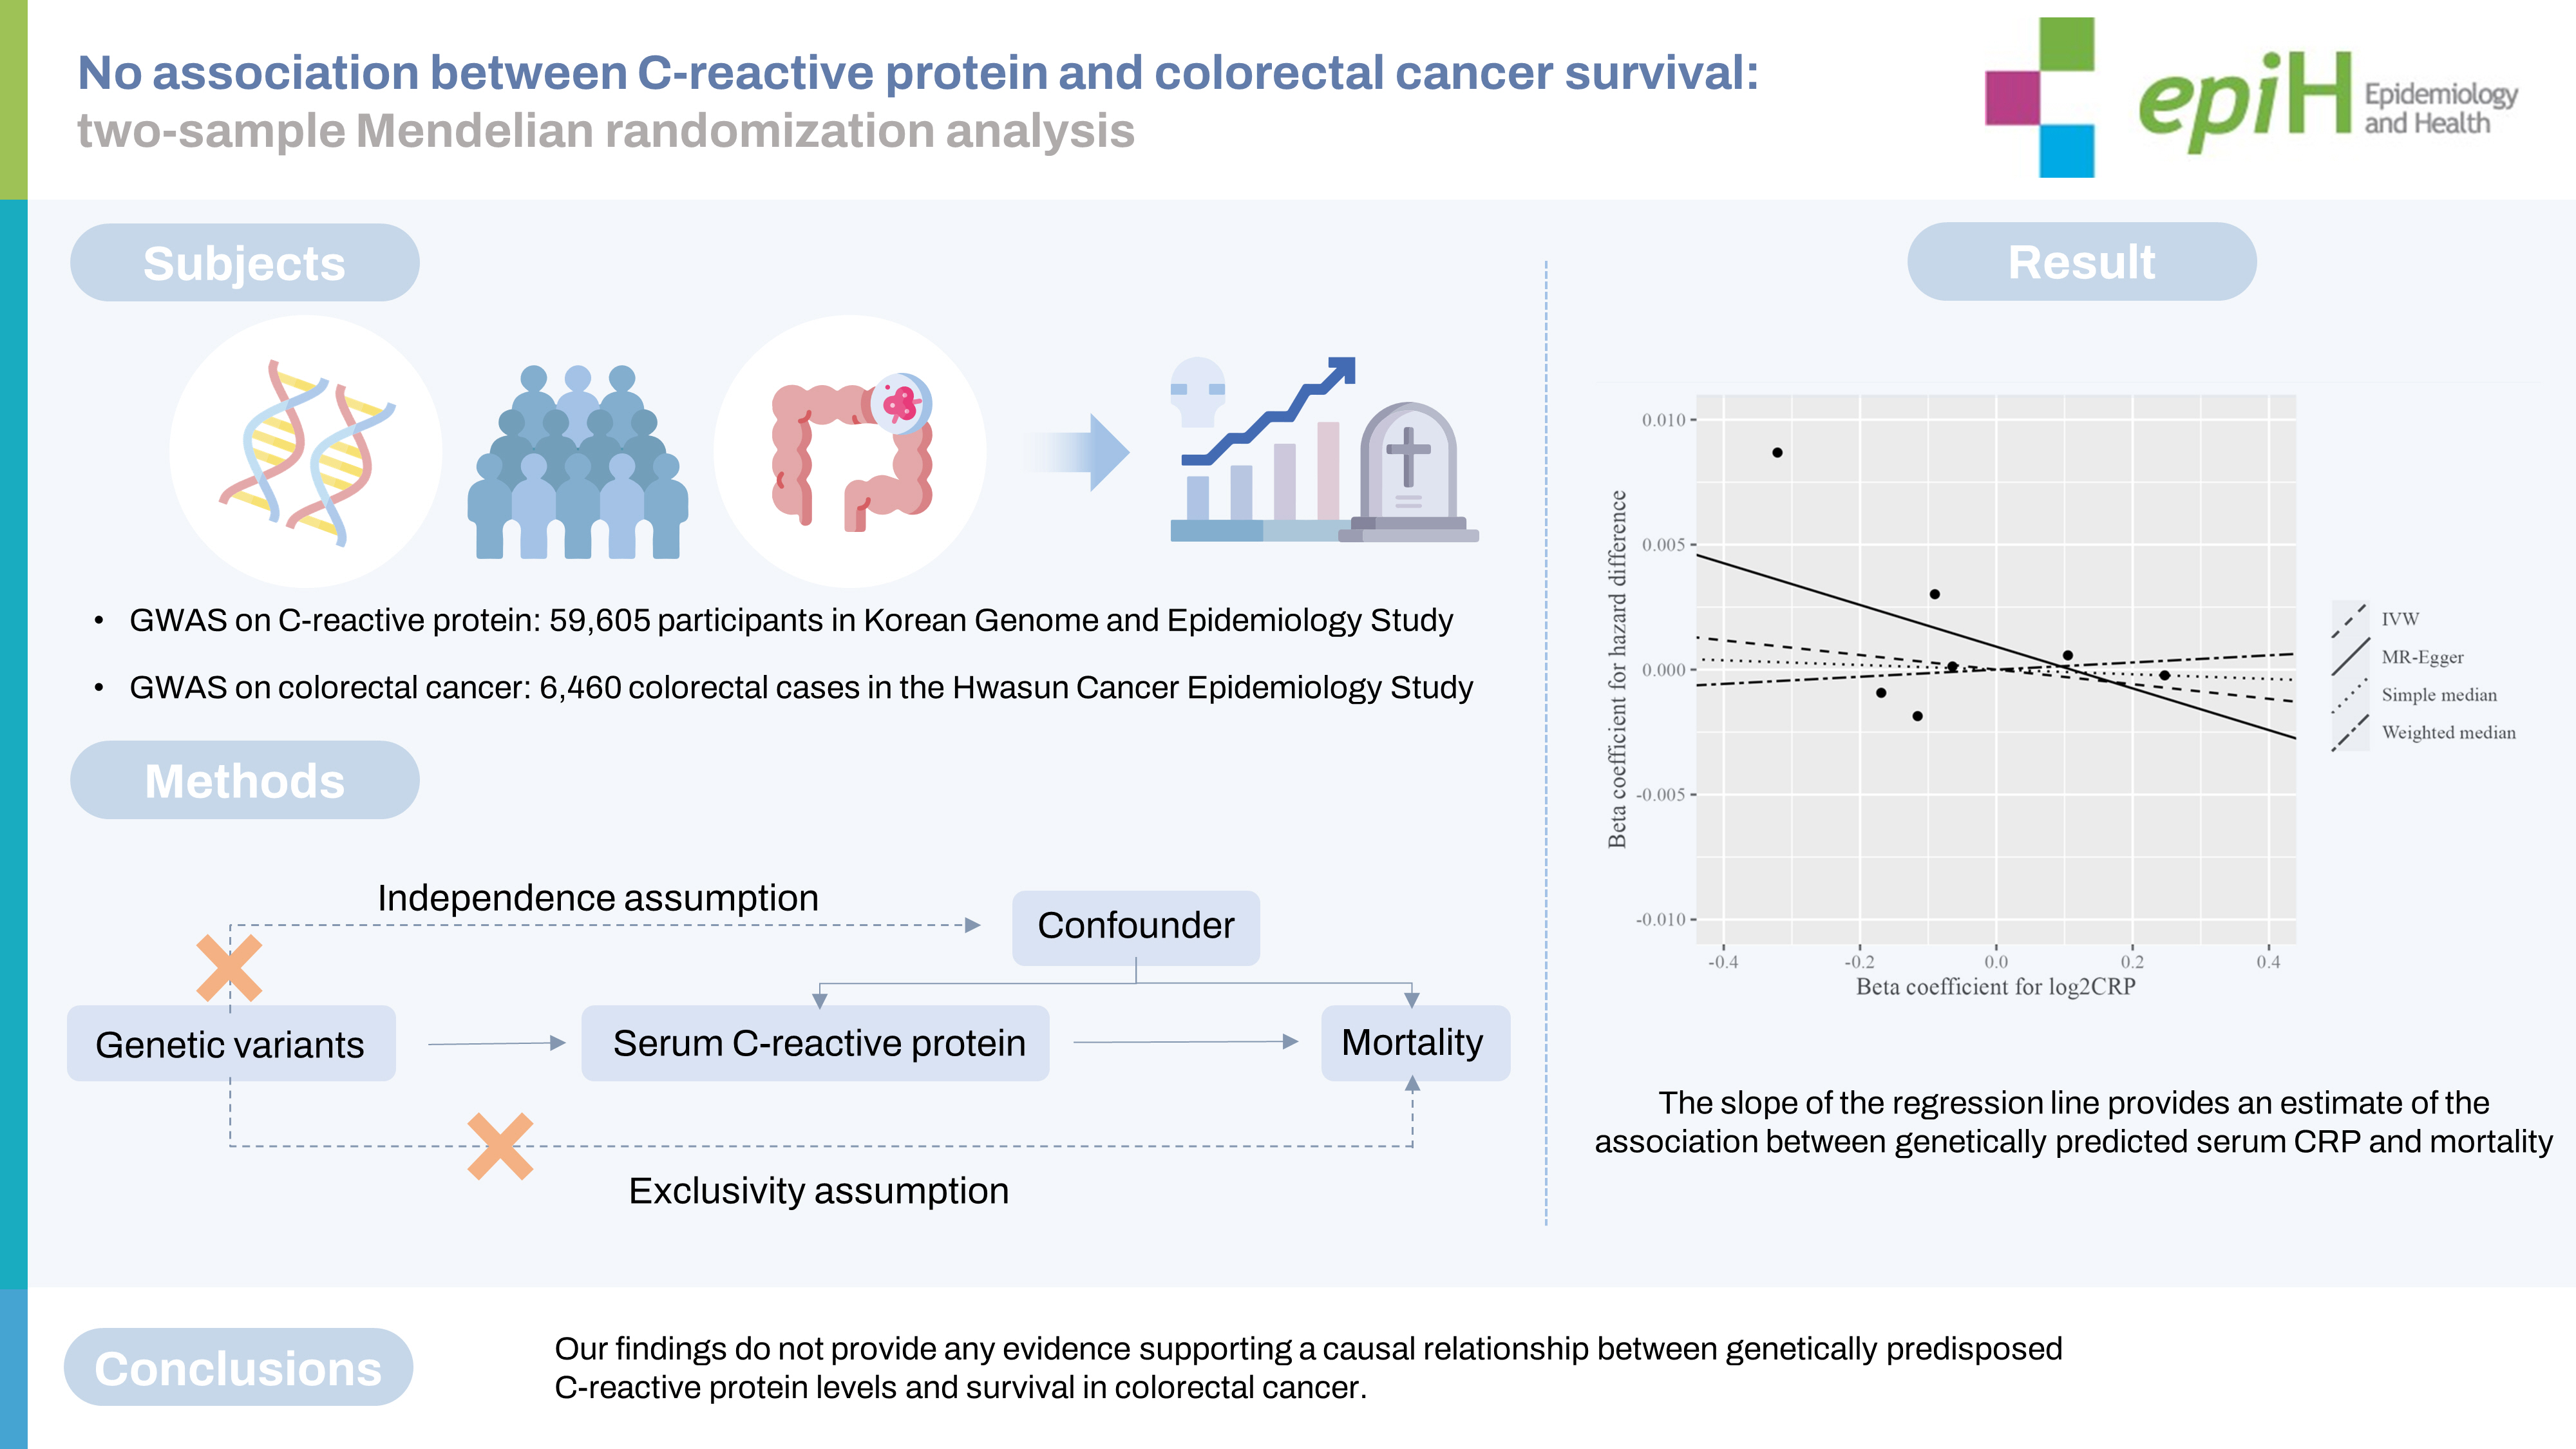
- Elevated C-reactive protein (CRP) levels are associated with an increased risk for colorectal cancer (CRC), as well as a poor prognosis, but it remains unclear whether these associations are causal. This study examined the potential causality between CRP levels and CRC survival using 2-sample Mendelian randomization (MR).
-
METHODS
- From the Korean Genome and Epidemiology Study, a genome-wide association study (n=59,605), 7 single-nucleotide polymorphisms (SNPs) related to log2-transformed CRP levels were extracted as instrumental variables for CRP levels. The associations between the genetically predicted CRP and CRC-specific and overall mortality among CRC patients (n=6,460) were evaluated by Aalen’s additive hazard model. The sensitivity analysis excluded a SNP related to the blood lipid profile.
-
RESULTS
- During a median of 8.5 years of follow-up, among 6,460 CRC patients, 2,676 (41.4%) CRC patients died from all causes and 1,622 (25.1%) died from CRC. Genetically predicted CRP levels were not significantly associated with overall or CRC-specific mortality in CRC patients. The hazard difference per 1,000 person-years for overall and CRC-specific mortality per 2-fold increase in CRP levels was -2.92 (95% confidence interval [CI], -14.05 to 8.21) and -0.76 (95% CI, -9.61 to 8.08), respectively. These associations were consistent in a subgroup analysis according to metastasis and a sensitivity analysis excluding possible pleiotropic SNPs.
-
CONCLUSIONS
- Our findings do not support a causal role for genetically predisposed CRP levels in CRC survival.
- C-reactive protein (CRP) is widely used as a clinical parameter to measure inflammatory status, and numerous observational studies have reported associations between elevated CRP levels and the risk of colorectal cancer (CRC) incidence [1,2], population mortality due to CRC [3,4], and the clinical prognosis of CRC patients, including death [5,6], metastasis [5,7], postoperative complications [8,9], and recurrence [5,10,11]. Three systematic reviews and meta-analyses have provided up-to-date information on the association between elevated CRP levels and a poor prognosis of CRC [10,12,13]. For various other solid tumors, as well as CRC, CRP is a variable that must be included when constructing a prognostic prediction model [10], including the Glasgow Prognostic Score, which is known to effectively predict the prognosis of CRC patients [14]. However, in these observational studies, it is difficult to differentiate between the deterioration of cancer-related inflammation and the clinical impact of elevated CRP levels themselves, because most studies analyzed peri-treatment CRP levels. The best timing for evaluating CRP-related markers remains unclear [6]. In addition, since the association between cancer progression and an immune response is often bidirectional and multifactorial, it is difficult to avoid reverse causality and residual confounding effects in observational studies [15]. To overcome these limitations and clarify the true causality, Mendelian randomization (MR) using genotypes as instrumental variables has been widely applied. Because genetic variants are randomly allocated by Mendel’s law, an MR study using genetic variants as instrumental variables can be independent of potential confounders and can exclude the possibility of reverse causality. However, constructing large data sets with intermediate phenotypes and genetic instruments is challenging due to the high cost of measurements and/or the lack of suitable biological specimens. In this context, 2-sample MR can evaluate the association between exposure and outcome using 2 independent existing genome-wide association studies (GWASs), and 2-sample MR is steadily becoming more common in research using MR analysis [16].
- GWASs have reported that several single-nucleotide polymorphisms (SNPs) were associated with CRP levels [17-19]; in the largest recent GWAS, those SNPs explained about 7.0% of the variance in CRP levels [17]. However, limited epidemiological data have been reported on the association between CRP-related genetic variants and the prognosis of CRC, and the findings are still inconsistent [20-23].
- The International Survival Analysis in Colorectal Cancer Consortium recently reported that genetically predicted CRP levels were not significantly associated with CRC-specific mortality in a GWAS of 16,918 European CRC cases [24]. However, since CRP levels vary among ethnicities [25] and several SNPs were found to be related to CRP levels only in a GWAS of East Asians [19,26,27], there remains a need for further research to clarify the association between CRP levels and survival of CRC in other ancestries. Therefore, we evaluated the causal role of genetically predicted CRP levels in the survival of CRC in Koreans by conducting a 2-sample MR study with representative Korean GWAS datasets.
INTRODUCTION
- Sources of the C-reactive protein genome-wide association study data
- Supplementary Material 1 shows the flow chart of the CRP GWAS. The association between SNPs and CRP levels was determined using the GWAS dataset from the Korean Genome and Epidemiology Study (KoGES) [28], a consortium project consisting of 6 prospective cohort studies supported by government funding. Over 223,000 participants have been recruited, with 72,298 from population-based studies (58,700 from the KoGES Health Examinee [KoGES_HEXA] study, 8,105 from the KoGES Cardiovascular Association Study [KoGES_CAVAS], and 5,493 from the KoGES Ansan and Ansung Study) who provided epidemiological information and genome-wide arrays after a quality control procedure. The KoGES_CAVAS and KoGES Ansan and Ansung Study consisted of community inhabitants, while the KoGES_HEXA study included participants recruited from the national health examinee registry. From the original sample, 10,358 participants whose serum CRP level was not measured, 146 participants with a serum CRP level ≥ 10 mg/L, 2,462 participants with a previous history of cancer, and 81 participants with missing values for a previous history of cancer were excluded from the analysis. Consequently, 59,605 participants were included in the final analysis (Supplementary Material 2). Genomic DNA was extracted from peripheral blood, and the GWAS was conducted using the Korean Biobank Array (K-CHIP) customized for the Korean population. Details on genotyping, GWAS quality control, and imputation have been described elsewhere [29]. K-CHIP contains 833,535 SNPs, including 89,413 SNPs present in East Asians. Imputation was conducted using the 1000 Genomes Phase 3 dataset of the East Asian population as a reference panel.
- Source of the colorectal cancer genome-wide association study data
- The CRC GWAS data were obtained from the Hwasun Cancer Epidemiology Study-Colon and Rectum Cancer (HCES-CRC). The Hwasun Cancer Epidemiology Study (HCES) is a hospital-based case-control study aiming to identify serologic and genetic risk factors for multiple cancers, including esophageal [30], breast [31], gastric [32], and colorectal cancers [33]. The HCES-CRC consisted of 7,089 hospital-based CRC cases and 4,979 populationbased cancer-free controls. Details of genotyping and GWAS quality control have been described elsewhere [33]. The baseline characteristics of the CRC GWAS are presented in Supplementary Material 3. In brief, the subjects were patients diagnosed with histologically confirmed CRC at Chonnam National University Hwasun Hospital between 2004 and 2014. Germline DNA genotyping was performed using the Infinium OncoArray-500K BeadChip (Illumina Inc., San Diego, CA, USA) in 3,158 CRC cases, and the Infinium Multi-Ethnic Global BeadChip (MEGA, Illumina Inc.) in 3,465 cases. Of those, 163 cases without information on the tumor, node, metastasis stage were excluded, and 6,460 CRC cases were finally included in the analysis. The cause and date of death were obtained from the National Statistical Office. The date of death was ascertained until December 31, 2020. The cause of death was coded according to the International Classification of Diseases, 10th revision. The details of the HCES-CRC and imputation procedure have been described previously [34]. The analysis included SNPs with an info score greater than 0.4.
- Associations between genetic variants, C-reactive protein levels, and colorectal cancer survival
- This study consisted of a discovery cohort of 47,258 individuals from KoGES_HEXA and a replication cohort of 12,347 individuals from KoGES_CAVAS and the KoGES Ansan and Ansung Study. Multivariate linear regression was performed to evaluate the association between genetic variants and log2-transformed serum CRP levels. Age, sex, survey year, and the assessment centers of cohort studies were adjusted. The first 10 principal components were also adjusted to correct for the possible population structure in the GWAS. The statistical analyses were performed using PLINK version 1.90b6.0 (https://www.cog-genomics.org/plink/). SNPs with a minor allele frequency (MAF) < 0.05 were excluded from the analysis, leaving 1,859 SNPs significantly associated with log2-transformed serum CRP levels in KoGES (p< 5× 10⁻⁸). We used a linkage disequilibrium (LD)-based clumping cut-off of r2 <0.001 and a window size of 10,000 kb directly from the KoGES genotyping data. The results of the discovery and replication phases are presented in Supplementary Material 4. Discovery analysis identified 13 significant SNPs associated with serum CRP levels, of which 7 were replicated. The replicated SNPs were rs2794520 near CRP, rs12133641 in IL6R, rs71086917 in LINC02819, rs1260326 in GCKR, rs7383869 near IL6, rs79320731 in HNF1A, and rs429358 in APOE.
- The association between selected SNPs and log2-transformed serum CRP levels was re-evaluated in a pooled analysis, and these results were used for the MR study. The minimum value of the F-statistics of the selected SNPs was 61.2, and it was expected that the bias by weak instruments in the main analysis would not be significant.
- Because Aalen’s additive hazard model preserves linearity, it can be used in 2-sample MR analysis regardless of the proportional hazard assumption [35]. Therefore, we conducted Aalen additive hazard regression to evaluate the association between CRP-related SNPs and CRC survival using the R package “timereg.” Statistical analyses were performed using R version 4.2.0 (R Foundation for Statistical Computing, Vienna, Austria).
- Two-sample Mendelian randomization and genetic risk score
- We estimated genetically predicted CRP levels and CRC survival using the inverse-variance weighted (IVW) method using the R package “MendelianRandomization” [36].
- The estimated associations of genetically predicted CRP levels with hazard differences (HDs) in mortality were expressed with respect to a 2-fold increase in the serum CRP level.
- Seven SNPs were selected as instrumental variables to calculate the weighted genetic risk score (GRS) for the log2-transformed serum CRP level. Supplementary Material 5 shows the distribution of the weighted GRS for CRP and CRC GWAS. In PLINK, the weights are the estimated beta coefficients associated with each copy of the minor allele in a linear regression analysis. The mean GRS per non-missing genetic marker was calculated and the GRS was divided into quintiles (Q1 to Q5).
- Statistical power
- To the best of our knowledge, there is no available tool to estimate statistical power for survival outcomes in MR. Instead, we used a conservative tool that considered binary survival outcomes [37]. Of a total of 6,460 CRC cases, 2,676 (41.4%) deaths occurred over an 8-year follow-up period. In previous meta-analysis of CRC patients, the hazard ratios (HRs) for overall survival of elevated CRP levels and CRP-to-albumin ratio were 2.04 [12] and 2.03 [13], respectively. We had more than 90% power to detect an odds ratio (OR) of 1.50 for the association between CRP levels and overall mortality at a significance level of 0.05, assuming that the GRS would explain 4.0% of the variance in CRP levels.
- In addition, we ran a simulation using an additive hazards model for power calculation. With 6,460 CRC cases and 2,676 deaths accrued over an 8-year follow-up, the population-averaged hazard was estimated to be 2,676/(6,460× 8)= 0.052 per person-year (PY). We had at least 90% power to detect a 50.0% difference in hazard (HD, 0.026) for every 1 standard deviation (SD) increase in log2-transformed CRP levels, assuming that 4.0% of the variance of CRP was explained by the GRS. The R code for the simulation was modified from the R code in the study of Hua et al. [24].
- Sensitivity analysis
- MR relies on 3 assumptions. First, genetic variants are associated with the exposure (CRP). Second, genetic variants are not associated with potential confounders. Third, genetic variants are not directly associated with the outcome (death), except through the exposure (a lack of horizontal pleiotropic effects). In our study, the selected SNPs were validated in the CRP GWAS and were independent of each other (not in LD). In addition, using Phenoscanner, a database of GWAS results, the pleiotropic effects of the selected SNPs were checked [38], and an association of rs429358 near APOE with the blood lipid profile was reported [39,40]. Therefore, we performed an additional sensitivity analysis excluding rs429358.
- For 2-sample MR, 3 sensitivity analyses (simple and weighted median, and MR-Egger regression) were performed. Although the IVW method is sensitive to violations of the assumption regarding pleiotropy, the results from the simple and weighted median are consistent even when up to 50% of the information comes from invalid instrumental variables [41]. The intercept estimated from the MR-Egger regression provides an estimate of the horizontal pleiotropic effect [42].
- Ethics statement
- The KoGES was reviewed and approved by the Korea Centers for Disease Control and Prevention in Korea (IRB No. 2015-08EXP01-C-A and 2016-02-20-C-A). Informed consent was obtained from the participants.
- The HCES-CRC was reviewed and approved by the Chonnam National University Hwasun Hospital Institutional Review Board (IRB No. CNUHH-2020-063). All patients and controls gave informed consent to study participation at the time of peripheral blood collection.
MATERIALS AND METHODS
- As shown in Table 1, SNPs in 7 loci were associated with log2-transformed CRP levels, as follows: rs2794520 near CRP (p=7.23×10-200), rs12133641 in IL6R (p=3.52×10-47), rs71086917 in LINC02819 (p=6.54×10⁻¹⁶), rs1260326 in GCKR (p=1.31×10⁻²⁹), rs7383869 near IL6 (p=3.53×10-37), rs79320731 in HNF1A (p=1.22× 10-99), and rs429358 in APOE (p=3.53×10-125). The estimated log2-transformed CRP variance explained by the selected SNPs was 4.0%.
- Among these SNPs, rs2794520 (CRP) [17], rs12133641 (IL6R) [27,43], rs1260326 (GCKR) [39], and rs429358 (APOE) [17] have been reported to be associated with CRP levels in previous studies. For rs7383869 (IL6) and rs79320731 (HNF1A), the LD blocks of those SNPs contained rs2097677 (R2 = 0.42) and rs7310409 (R2 = 0.90), respectively, as reported by a previous GWAS in the Japanese population [26].
- There are 2 possible explanations for the association between the remaining novel SNP, rs71086917 (LINC02819), and CRP levels. First, although, to our knowledge, an association between LINC02819 and CRP has not been reported in previous studies, rs10908724 in LINC02819 and in the LD block for rs71086917 (R2 = 0.180) was related to MCP-1 [44], which mediates the chemotaxis of CRP [45]. However, since the results of the GWAS do not reveal the function of the SNP, the association between the regulation of LINC02819 and CRP or MCP-1 still needs to be evaluated. Second, rs10908724 may be a proxy SNP for rs3093068 (CRP) identified in a previous GWAS [43]. In our genotype data, rs10908724 was correlated to rs3093068 (R2 = 0.02).
- Table 2 presents the effects of genetically predicted CRP levels on the risk of death using summary statistics and the GRS. The effects estimated by the IVW method showed that a 2-fold increase in serum CRP levels was not significantly associated with the risk of overall or CRC-specific mortality (HD per 1,000 PY: -2.92 and -0.76, respectively; 95% CI, -14.05 to 8.21 and -9.61 to 8.08, respectively). Furthermore, the results of sensitivity analyses using the simple median and median weighted estimation were consistent with the main results. The MR-Egger intercept showed no significant evidence of pleiotropic effects (p= 0.669 for overall mortality and p= 0.876 for CRC-specific mortality). These non-significant results were similar in the sensitivity analysis that excluded the SNP related to the blood lipid profile. The scatter plot of SNP-specific associations with CRC-specific survival against coefficients of SNP-CRP associations and the regression line depicting the association between genetically predicted CRP levels and survival are visualized in Supplementary Materials 6 and 7, respectively. The linear association between a 1-SD increment of the GRS for CRP levels was not significantly associated with CRC-specific mortality (HD per 1,000 PY, -2.09; 95% CI, -4.26 to 0.08). The GRS for CRP levels demonstrated a significant association with overall mortality (HR per 1,000 PY, -2.09; 95% CI, -5.77 to -0.59). Additionally, compared to the third quintile of the GRS for CRP levels, the HR for the first quintile of the GRS for CRP levels was 8.53 (95% CI, 1.12 to 15.94). However, these associations were not observed in a sensitivity analysis that excluded rs429358, a variant known to be associated with the blood lipid profile.
- Table 3 presents the subgroup analysis according to metastasis. In the analyses using summary statistics and the individual GRS, the association between genetically predicted CRP levels and mortality was not significant, regardless of metastasis.
RESULTS
- This study did not find evidence for an association between genetically elevated CRP levels and survival among CRC patients in Korea. Consistent results were found in a sensitivity analysis excluding a possible pleiotropic SNP and a subgroup analysis according to metastasis.
- The effect of CRP levels on survival was recently evaluated in CRC cases of European ancestry using 2-sample MR [24]. Similar to our results, Hua et al. [24] reported that genetically predicted CRP levels were not associated with CRC-specific mortality regardless of metastasis. Compared to the instrumental variants used by Hua et al. [24], among the 7 CRP-related SNPs used in our study, 2 SNPs (rs2794520 and rs1260326) were consistent, and 3 correlated SNPs (rs12133641, rs79320731, and rs429358) were included in the same LD blocks. In addition, the effecting alleles showed a consistent directionality in terms of their impact on CRP levels. However, the effective allele frequency (EAF) and effect size of selected SNPs were different, which is presumed to be due to ethnic differences. The EAF and effect size of rs1260326 were 0.450 and 0.008, respectively, in our study, compared to 0.610 and -0.050, respectively, in the study of Hua et al. [24]. In particular, rs1880241, which was included in the study of Hua et al. [24] was excluded from our CRP GWAS because of its low MAF in the East Asian population (< 0.01). Nonetheless, we could not find a causal effect of CRP levels on survival in CRC patients in this East Asian population, similar to findings in the previously studied European population.
- Although not MR studies, several previous genetic studies have investigated survival in CRC patients. Two studies evaluated associations between CRP-related SNPs and mortality in CRC patients, but the results were also not significant [21,22]. Two GWASs examined survival in CRC patients. In the Scottish Colorectal Cancer Study [46], no variants reached the p-value threshold for statistical significance. In contrast, Phipps et al. [47] reported that rs209489 was associated with poor survival in patients with distant metastatic CRC. However, since rs209489 was not significantly associated with log2-transformed CRP levels in our GWAS, we did not consider this SNP.
- Regarding the association between CRP levels and CRC survival, contrary to our findings, previous observational studies have reported that high CRP levels were associated with a poor CRC prognosis. A meta-analysis of 21 observational studies reported that an elevated preoperative CRP level was associated with poor survival with pooled HRs of 2.04 (95% CI, 1.45 to 2.85) for overall survival and 4.37 (95% CI, 2.63 to 7.27) for CRC-specific survival [12]. In a study of CRC patients treated with neoadjuvant therapy and surgery, CRP levels were associated with disease-free survival independently of carcinoembryonic antigen levels or resection margins [5]. Another meta-analysis using the CRP-to-albumin ratio had similar results [13]. However, since the treatment, stage, and CRP cut-off varied in those studies, it is difficult to distinguish between the effects of cancer-related inflammation and circulating CRP. The prognostic role of CRP levels in CRC patients remains a matter of debate in studies of cancer-free general populations. In the general population, the effects of cancer-related inflammation on the association between CRP and CRC prognosis would be reduced, although inconsistent findings have been reported regarding a positive association between elevated pre-diagnostic CRP levels and CRC mortality. In the National Health and Nutrition Examination Survey III, CRP levels were positively associated with CRC-specific mortality in the general population [3], while the Apolipoprotein Mortality Risk Study reported a null association [48], and the Copenhagen City Heart Study [49] reported a possible association between baseline CRP levels and CRC-specific mortality in their cohort.
- Chronic inflammation induces cancer invasion, progression, and metastasis, and influences the efficacy of chemotherapy and immunotherapy [50]. CRP, which is synthesized in the liver, is an acute-phase protein that reflects inflammation. However, we did not find an effect of genetically predicted CRP levels on CRC survival as a systemic inflammatory mediator, unlike many previous case-control studies [5,7,15], prospective studies [3,4], and meta-analyses [10,12,13]. However, since the potential causal role of CRP was not confirmed in previous Mendelian studies, the observed effect of CRP elevation on CRC mortality may be due to residual effects or reverse causality.
- Our study had several limitations. First, since information on recurrence was not available, disease-free survival was not included in the analysis. Second, the batch effect may not have been excluded in CRP and CRC GWAS. Therefore, to minimize the batch effect, we evaluated the association between genetic variants and serum CRP levels by statistically adjusting for survey years and study sites in the CRP GWAS, and the association between genetic variants and survival by statistically adjusting for genotyping arrays in the CRC GWAS. Third, because there were only 804 metastatic CRC cases in our study, a further evaluation is needed to clarify the effect of CRP levels on survival in patients with metastatic CRC. Fourth, to confirm the null association between CRP levels and mortality in CRC patients, future studies with higher statistical power are needed. In particular, to improve the power of the MR analysis, the CRP variance explained by genetic instruments should be discussed in terms of the biological effects of selected SNPs or CRP levels on cancer mortality to compensate for the lack of functional analysis of SNPs.
- In summary, we found that genetically predicted CRP levels were not associated with the overall or CRC-specific survival of CRC patients. Therefore, our results suggest that genetically predisposed circulating CRP levels do not play a causal role in the prognosis of CRC.
DISCUSSION
SUPPLEMENTARY MATERIALS
Supplementary Material 2.
Supplementary Material 3.
Supplementary Material 4.
Supplementary Material 5.
Supplementary Material 6.
Supplementary Material 7.
-
CONFLICT OF INTEREST
The authors have no conflicts of interest to declare for this study.
-
FUNDING
This study was financially supported by Chonnam National University Hwasun Hospital (HCRI21019).
-
AUTHOR CONTRIBUTIONS
Conceptualization: Kweon SS. Data curation: Kweon SS, Shin MH. Formal analysis: Choi CK, Yang JH. Funding acquisition: Kweon SS. Methodology: Kweon SS, Choi CK. Writing – original draft: Kweon SS, Choi CK. Writing – review & editing: Kweon SS, Choi CK, Yang JH, Shin MH, Cho SH.
NOTES
ACKNOWLEDGEMENTS

| SNP | Chr | Nearby gene | Position1 | EA | RA |
CRP GWAS2 |
CRC GWAS3 |
|||||||
|---|---|---|---|---|---|---|---|---|---|---|---|---|---|---|
| EAF | F | Beta | p-value | EAF | Overall mortality HD (/1,000 PY) | p-value | CRC mortality HD (/1,000 PY) | p-value | ||||||
| rs2794520 | 1 | CRP | 159678816 | C | T | 0.365 | 961.9 | 0.247 | 7.23×10-200 | 0.366 | -0.230 | 0.887 | 0.018 | 0.989 |
| rs12133641 | 1 | IL6R | 154428283 | G | A | 0.433 | 197.0 | -0.116 | 3.52×10-47 | 0.429 | -1.860 | 0.210 | -0.454 | 0.701 |
| rs71086917 | 1 | LINC02819 | 159455503 | insA | - | 0.452 | 61.2 | -0.064 | 6.54×10⁻¹⁶ | 0.414 | 0.127 | 0.938 | 0.934 | 0.493 |
| rs1260326 | 2 | GCKR | 27730940 | C | T | 0.450 | 133.0 | -0.090 | 1.31×10⁻²⁹ | 0.452 | 3.017 | 0.050 | 1.535 | 0.201 |
| rs7383869 | 7 | IL6 | 22748190 | A | G | 0.362 | 164.1 | 0.105 | 3.53×10-37 | 0.365 | 0.571 | 0.693 | 0.562 | 0.620 |
| rs79320731 | 12 | HNF1A | 121422449 | CTGACTGGCACTCAGCA | T | 0.455 | 461.1 | -0.169 | 1.22×10-99 | 0.454 | -0.929 | 0.530 | -1.999 | 0.095 |
| rs429358 | 19 | APOE | 45411941 | C | T | 0.096 | 587.6 | -0.321 | 3.53×10-125 | 0.057 | 8.684 | 0.011 | 7.331 | 0.014 |
SNP, single-nucleotide polymorphism; CRP, C-reactive protein; Chr, chromosome; CRC, colorectal cancer; EA, effective allele; EAF, effective allele frequency; GWAS, genome-wide association study; HD, hazard difference; PY, person-year; RA, reference allele.
1 The positions of the SNPs were derived from GRCh37.
2 Age, sex, study centers, survey years, and first 10 principal components were adjusted in all models.
3 Age, sex, genotyping array, tumor, node, metastasis stage, and first 10 principal components were adjusted in all models.
| Variables |
Main analysis (7 serum CRP level-related SNPs) |
Sensitivity analysis (excluding rs429358) |
|||||||
|---|---|---|---|---|---|---|---|---|---|
| Overall mortality | p-value | CRC-specific | p-value | Overall mortality | p-value | CRC-specific mortality | p-value | ||
| Using summary statistics1 | |||||||||
| IVW | -2.92 (-14.05, 8.21) | 0.607 | -0.76 (-9.61, 8.08) | 0.866 | 1.11 (-8.18, 10.40) | 0.815 | 2.40 (-4.51, 9.31) | 0.497 | |
| Simple median | -0.93 (-13.67, 11.81) | 0.886 | 0.07 (-10.64, 10.78) | 0.989 | 2.25 (-9.74, 14.24) | 0.713 | 2.00 (-7.80, 11.80) | 0.689 | |
| Weighted median | 1.43 (-8.96, 11.81) | 0.788 | 1.70 (-7.00, 10.41) | 0.701 | 3.39 (-7.00, 13.78) | 0.523 | 2.71 (-5.97, 11.39) | 0.540 | |
| MR-Egger intercept | 0.92 (-3.29, 5.12) | 0.669 | 0.27 (-3.11, 3.65) | 0.876 | -0.57 (-4.21, 3.08) | 0.760 | -1.02 (-3.52, 1.49) | 0.426 | |
| Using individual GRS2 | |||||||||
| GRS per 1 SD increment | -3.18 (-5.77, -0.59) | 0.016 | -2.09 (-4.26, 0.08) | 0.056 | 0.17 (-1.82, 2.16) | 0.870 | 0.11 (-1.49, 1.70) | 0.897 | |
| GRS quintile | |||||||||
| 1st | 8.53 (1.12, 15.94) | 0.024 | 5.51 (-0.71, 11.73) | 0.082 | 1.94 (-4.47, 8.34) | 0.554 | 2.39 (-2.17, 6.95) | 0.349 | |
| 2nd | 1.86 (-5.16, 8.88) | 0.603 | 1.04 (-4.85, 6.93) | 0.730 | -2.15 (-8.56, 4.27) | 0.512 | -1.41 (-5.96, 3.14) | 0.598 | |
| 3rd | 1.00 (reference) | 1.00 (reference) | 1.00 (reference) | 1.00 (reference) | |||||
| 4th | -2.64 (-9.13, 3.85) | 0.425 | -1.54 (-6.68, 3.60) | 0.557 | -0.52 (-6.74, 5.70) | 0.870 | -2.06 (-6.53, 2.40) | 0.417 | |
| 5th | 1.14 (-5.17, 7.45) | 0.723 | 0.99 (-4.12, 6.09) | 0.705 | 2.00 (-4.45, 8.45) | 0.554 | 3.16 (-1.45, 7.77) | 0.229 | |
Values are presented as hazard difference per 1,000 person-year (95% confidence interval).
CRC, colorectal cancer; CRP, C-reactive protein; GRS, genetic risk score; IVW, inverse-variance weighted method; SD, standard deviation; SNP, single-nucleotide polymorphism.
1 Results are expressed per 2-fold increase in serum CRP levels.
2 Age, sex, genotyping array, and tumor, node, metastasis stage were adjusted.
| Variables |
Non-metastatic CRC |
Metastatic CRC |
|||||||
|---|---|---|---|---|---|---|---|---|---|
| Overall mortality | p-value | CRC-specific mortality | p-value | Overall mortality | p-value | CRC-specific mortality | p-value | ||
| Using summary statistics1 | |||||||||
| IVW | 1.73 (-6.95, 10.41) | 0.697 | 3.37 (-3.41, 10.15) | 0.330 | -27.69 (-95.81, 40.43) | 0.426 | -28.19 (-91.79, 35.42) | 0.385 | |
| Simple median | 3.57 (-6.96, 14.09) | 0.506 | 2.96 (-5.93, 11.85) | 0.514 | -24.08 (-121.25, 73.10) | 0.627 | 8.90 (-85.99, 103.79) | 0.854 | |
| Weighted median | 4.73 (-3.69, 13.16) | 0.271 | 5.11 (-1.29, 11.51) | 0.117 | -42.26 (-125.36, 40.83) | 0.319 | -30.04 (-108.51, 48.43) | 0.453 | |
| MR-Egger intercept | 0.04 (-3.37, 3.44) | 0.984 | -0.68 (-3.24, 1.89) | 0.605 | 12.62 (-10.94, 36.18) | 0.294 | 12.53 (-9.56, 34.62) | 0.266 | |
| Using individual GRS2 | |||||||||
| GRS per 1 SD increment | -1.74 (-3.95, 0.46) | 0.121 | -0.45 (-2.20, 1.30) | 0.613 | -18.65 (-42.48, 5.17) | 0.125 | -22.65 (-45.57, 0.27) | 0.053 | |
| GRS quintile | |||||||||
| 1st | 3.00 (-3.48, 9.49) | 0.364 | 0.37 (-4.51, 5.26) | 0.881 | 61.88 (-5.52, 129.29) | 0.072 | 60.52 (-4.77, 125.81) | 0.069 | |
| 2nd | -2.96 (-8.76, 2.84) | 0.317 | -3.08 (-7.39, 1.22) | 0.160 | 45.84 (-14.95, 106.64) | 0.139 | 37.64 (-21.03, 96.31) | 0.209 | |
| 3rd | 1.00 (reference) | 1.00 (reference) | 1.00 (reference) | 1.00 (reference) | |||||
| 4th | -0.76 (-6.00, 4.49) | 0.778 | 0.61 (-3.21, 4.43) | 0.755 | -31.00 (-80.02, 18.02) | 0.215 | -30.44 (-72.34,11.46) | 0.155 | |
| 5th | -0.87 (-6.38, 4.65) | 0.758 | -0.07 (-3.94, 3.80) | 0.972 | 17.10 (-35.25, 69.44) | 0.522 | 2.43 (-43.66, 48.53) | 0.918 | |
Values are presented as hazard difference per 1,000 person-year (95% confidence interval).
CRC, colorectal cancer; CRP, C-reactive protein; GRS, genetic risk score; IVW, inverse-variance weighted method; SD, standard deviation.
1 Results are expressed per 2-fold increase in serum CRP levels.
2 Age, sex, and genotyping array were adjusted.
- 1. Wu J, Cai Q, Li H, Cai H, Gao J, Yang G, et al. Circulating C-reactive protein and colorectal cancer risk: a report from the Shanghai Men’s Health Study. Carcinogenesis 2013;34:2799-2803.ArticlePubMedPMC
- 2. Zhou B, Shu B, Yang J, Liu J, Xi T, Xing Y. C-reactive protein, interleukin-6 and the risk of colorectal cancer: a meta-analysis. Cancer Causes Control 2014;25:1397-1405.ArticlePubMedPDF
- 3. Goyal A, Terry MB, Jin Z, Siegel AB. C-reactive protein and colorectal cancer mortality in U.S. adults. Cancer Epidemiol Biomarkers Prev 2014;23:1609-1618.ArticlePubMedPDF
- 4. Swede H, Hajduk AM, Sharma J, Rawal S, Rasool H, Vella AT, et al. Baseline serum C-reactive protein and death from colorectal cancer in the NHANES III cohort. Int J Cancer 2014;134:1862-1870.ArticlePubMed
- 5. Partl R, Lukasiak K, Thurner EM, Renner W, Stranzl-Lawatsch H, Langsenlehner T. The elevated pre-treatment C-reactive protein predicts poor prognosis in patients with locally advanced rectal cancer treated with neo-adjuvant radiochemotherapy. Diagnostics (Basel) 2020;10:780.ArticlePubMedPMC
- 6. Yamamoto M, Saito H, Uejima C, Tanio A, Takaya S, Sakamoto T, et al. Prognostic value of the combination of pre- and postoperative C-reactive protein in colorectal cancer patients. Surg Today 2018;48:986-993.ArticlePubMedPDF
- 7. Ishizuka M, Nagata H, Takagi K, Kubota K. C-reactive protein is associated with distant metastasis of T3 colorectal cancer. Anticancer Res 2012;32:1409-1415.PubMed
- 8. Fujikawa H, Okugawa Y, Yamamoto A, Imaoka H, Shimura T, Kitajima T, et al. Cumulative C-reactive protein in the perioperative period as a novel marker for oncological outcome in patients with colorectal cancer undergoing curative resection. J Anus Rectum Colon 2021;5:281-290.ArticlePubMedPMC
- 9. Stephensen BD, Reid F, Shaikh S, Carroll R, Smith SR, Pockney P, et al. C-reactive protein trajectory to predict colorectal anastomotic leak: PREDICT Study. Br J Surg 2020;107:1832-1837.ArticlePubMedPDF
- 10. Shrotriya S, Walsh D, Bennani-Baiti N, Thomas S, Lorton C. Creactive protein is an important biomarker for prognosis tumor recurrence and treatment response in adult solid tumors: a systematic review. PLoS One 2015;10:e0143080.ArticlePubMedPMC
- 11. Matsubara D, Arita T, Nakanishi M, Kuriu Y, Murayama Y, Kudou M, et al. The impact of postoperative inflammation on recurrence in patients with colorectal cancer. Int J Clin Oncol 2020;25:602-613.ArticlePubMedPDF
- 12. Woo HD, Kim K, Kim J. Association between preoperative C-reactive protein level and colorectal cancer survival: a meta-analysis. Cancer Causes Control 2015;26:1661-1670.ArticlePubMedPDF
- 13. Liao CK, Yu YL, Lin YC, Hsu YJ, Chern YJ, Chiang JM, et al. Prognostic value of the C-reactive protein to albumin ratio in colorectal cancer: an updated systematic review and meta-analysis. World J Surg Oncol 2021;19:139.ArticlePubMedPMCPDF
- 14. He L, Li H, Cai J, Chen L, Yao J, Zhang Y, et al. Prognostic value of the Glasgow Prognostic Score or modified Glasgow Prognostic Score for patients with colorectal cancer receiving various treatments: a systematic review and meta-analysis. Cell Physiol Biochem 2018;51:1237-1249.ArticlePubMedPDF
- 15. Allin KH, Nordestgaard BG. Elevated C-reactive protein in the diagnosis, prognosis, and cause of cancer. Crit Rev Clin Lab Sci 2011;48:155-170.ArticlePubMed
- 16. Hartwig FP, Davies NM, Hemani G, Davey Smith G. Two-sample Mendelian randomization: avoiding the downsides of a powerful, widely applicable but potentially fallible technique. Int J Epidemiol 2016;45:1717-1726.ArticlePubMed
- 17. Ligthart S, Vaez A, Võsa U, Stathopoulou MG, de Vries PS, Prins BP, et al. Genome analyses of > 200,000 individuals identify 58 loci for chronic inflammation and highlight pathways that link inflammation and complex disorders. Am J Hum Genet 2018;103:691-706.PubMedPMC
- 18. Kocarnik JM, Pendergrass SA, Carty CL, Pankow JS, Schumacher FR, Cheng I, et al. Multiancestral analysis of inflammation-related genetic variants and C-reactive protein in the population architecture using genomics and epidemiology study. Circ Cardiovasc Genet 2014;7:178-188.ArticlePubMedPMC
- 19. Vinayagamoorthy N, Hu HJ, Yim SH, Jung SH, Jo J, Jee SH, et al. New variants including ARG1 polymorphisms associated with C-reactive protein levels identified by genome-wide association and pathway analysis. PLoS One 2014;9:e95866.ArticlePubMedPMC
- 20. Huang Y, Hua X, Labadie JD, Harrison TA, Dai JY, Lindstrom S, et al. Genetic variants associated with circulating C-reactive protein levels and colorectal cancer survival: sex-specific and lifestyle factors specific associations. Int J Cancer 2022;150:1447-1454.ArticlePubMedPMCPDF
- 21. Slattery ML, Curtin K, Poole EM, Duggan DJ, Samowitz WS, Peters U, et al. Genetic variation in C-reactive protein in relation to colon and rectal cancer risk and survival. Int J Cancer 2011;128:2726-2734.ArticlePubMed
- 22. Yang SH, Huang CJ, Chang SC, Lin JK. Association of C-reactive protein gene polymorphisms and colorectal cancer. Ann Surg Oncol 2011;18:1907-1915.ArticlePubMedPDF
- 23. Huang CJ, Teng HW, Chien CC, Lin JK, Yang SH. Prognostic significance of C-reactive protein polymorphism and KRAS/BRAF in synchronous liver metastasis from colorectal cancer. PLoS One 2013;8:e65117.ArticlePubMedPMC
- 24. Hua X, Dai JY, Lindström S, Harrison TA, Lin Y, Alberts SR, et al. Genetically predicted circulating C-reactive protein concentration and colorectal cancer survival: a Mendelian randomization consortium study. Cancer Epidemiol Biomarkers Prev 2021;30:1349-1358.ArticlePubMedPMCPDF
- 25. Morimoto Y, Conroy SM, Ollberding NJ, Kim Y, Lim U, Cooney RV, et al. Ethnic differences in serum adipokine and C-reactive protein levels: the multiethnic cohort. Int J Obes (Lond) 2014;38:1416-1422.ArticlePubMedPMCPDF
- 26. Okada Y, Takahashi A, Ohmiya H, Kumasaka N, Kamatani Y, Hosono N, et al. Genome-wide association study for C-reactive protein levels identified pleiotropic associations in the IL6 locus. Hum Mol Genet 2011;20:1224-1231.ArticlePubMed
- 27. Kanai M, Akiyama M, Takahashi A, Matoba N, Momozawa Y, Ikeda M, et al. Genetic analysis of quantitative traits in the Japanese population links cell types to complex human diseases. Nat Genet 2018;50:390-400.ArticlePubMedPDF
- 28. Kim Y, Han BG; KoGES group. Cohort profile: the Korean Genome and Epidemiology Study (KoGES) consortium. Int J Epidemiol 2017;46:e20.ArticlePubMed
- 29. Moon S, Kim YJ, Han S, Hwang MY, Shin DM, Park MY, et al. The Korea Biobank Array: design and identification of coding variants associated with blood biochemical traits. Sci Rep 2019;9:1382.ArticlePubMedPMCPDF
- 30. Choi CK, Yang J, Kweon SS, Cho SH, Kim HY, Myung E, et al. Association between ALDH2 polymorphism and esophageal cancer risk in South Koreans: a case-control study. BMC Cancer 2021;21:254.ArticlePubMedPMCPDF
- 31. Han MR, Long J, Choi JY, Low SK, Kweon SS, Zheng Y, et al. Genome-wide association study in East Asians identifies two novel breast cancer susceptibility loci. Hum Mol Genet 2016;25:3361-3371.ArticlePubMedPMC
- 32. Choi CK, Kweon SS, Cho SH, Kim HY, Shin MH. Association between ALDH2 polymorphism and gastric cancer risk in a Korean population. J Korean Med Sci 2020;35:e148.ArticlePubMedPMCPDF
- 33. Lu Y, Kweon SS, Tanikawa C, Jia WH, Xiang YB, Cai Q, et al. Large-scale genome-wide association study of East Asians identifies loci associated with risk for colorectal cancer. Gastroenterology 2019;156:1455-1466.ArticlePubMed
- 34. Choi CK, Shin MH, Cho SH, Kim HY, Zheng W, Long J, et al. Association between ALDH2 and ADH1B polymorphisms and the risk for colorectal cancer in Koreans. Cancer Res Treat 2021;53:754-762.ArticlePubMedPDF
- 35. Cho Y, Rau A, Reiner A, Auer PL. Mendelian randomization analysis with survival outcomes. Genet Epidemiol 2021;45:16-23.ArticlePubMedPDF
- 36. Yavorska OO, Burgess S. MendelianRandomization: an R package for performing Mendelian randomization analyses using summarized data. Int J Epidemiol 2017;46:1734-1739.ArticlePubMedPMC
- 37. Brion MJ, Shakhbazov K, Visscher PM. Calculating statistical power in Mendelian randomization studies. Int J Epidemiol 2013;42:1497-1501.ArticlePubMed
- 38. Staley JR, Blackshaw J, Kamat MA, Ellis S, Surendran P, Sun BB, et al. PhenoScanner: a database of human genotype-phenotype associations. Bioinformatics 2016;32:3207-3209.ArticlePubMedPMCPDF
- 39. Ligthart S, Vaez A, Hsu YH; Inflammation Working Group of the CHARGE Consortium; PMI-WG-XCP; LifeLines Cohort Study, et al. Bivariate genome-wide association study identifies novel pleiotropic loci for lipids and inflammation. BMC Genomics 2016;17:443.ArticlePubMedPMC
- 40. Surakka I, Horikoshi M, Mägi R, Sarin AP, Mahajan A, Lagou V, et al. The impact of low-frequency and rare variants on lipid levels. Nat Genet 2015;47:589-597.ArticlePubMedPMCPDF
- 41. Bowden J, Davey Smith G, Haycock PC, Burgess S. Consistent estimation in Mendelian randomization with some invalid instruments using a weighted median estimator. Genet Epidemiol 2016;40:304-314.ArticlePubMedPMCPDF
- 42. Bowden J, Davey Smith G, Burgess S. Mendelian randomization with invalid instruments: effect estimation and bias detection through Egger regression. Int J Epidemiol 2015;44:512-525.ArticlePubMedPMC
- 43. Prins BP, Kuchenbaecker KB, Bao Y, Smart M, Zabaneh D, Fatemifar G, et al. Genome-wide analysis of health-related biomarkers in the UK Household Longitudinal Study reveals novel associations. Sci Rep 2017;7:11008.ArticlePubMedPMCPDF
- 44. Naitza S, Porcu E, Steri M, Taub DD, Mulas A, Xiao X, et al. A genome-wide association scan on the levels of markers of inflammation in Sardinians reveals associations that underpin its complex regulation. PLoS Genet 2012;8:e1002480.ArticlePubMedPMC
- 45. Han KH, Hong KH, Park JH, Ko J, Kang DH, Choi KJ, et al. Creactive protein promotes monocyte chemoattractant protein1--mediated chemotaxis through upregulating CC chemokine receptor 2 expression in human monocytes. Circulation 2004;109:2566-2571.ArticlePubMed
- 46. Theodoratou E, Farrington SM, Timofeeva M, Din FV, Svinti V, Tenesa A, et al. Genome-wide scan of the effect of common nsSNPs on colorectal cancer survival outcome. Br J Cancer 2018;119:988-993.ArticlePubMedPMCPDF
- 47. Phipps AI, Passarelli MN, Chan AT, Harrison TA, Jeon J, Hutter CM, et al. Common genetic variation and survival after colorectal cancer diagnosis: a genome-wide analysis. Carcinogenesis 2016;37:87-95.ArticlePubMed
- 48. Ghuman S, Van Hemelrijck M, Garmo H, Holmberg L, Malmström H, Lambe M, et al. Serum inflammatory markers and colorectal cancer risk and survival. Br J Cancer 2017;116:1358-1365.ArticlePubMedPMCPDF
- 49. Allin KH, Bojesen SE, Nordestgaard BG. Baseline C-reactive protein is associated with incident cancer and survival in patients with cancer. J Clin Oncol 2009;27:2217-2224.ArticlePubMed
- 50. Zhao H, Wu L, Yan G, Chen Y, Zhou M, Wu Y, et al. Inflammation and tumor progression: signaling pathways and targeted intervention. Signal Transduct Target Ther 2021;6:263.ArticlePubMedPMCPDF
 PubReader
 ePub Link
 Cite
Cite