Warning: fopen(/home/virtual/epih/journal/upload/ip_log/ip_log_2025-03.txt): failed to open stream: Permission denied in /home/virtual/lib/view_data.php on line 95 Warning: fwrite() expects parameter 1 to be resource, boolean given in /home/virtual/lib/view_data.php on line 96
1Dalla Lana School of Public Health, University of Toronto, Toronto, ON, Canada
2People’s Health Institute, Seoul, Korea
©2020, Korean Society of Epidemiology
This is an open-access article distributed under the terms of the Creative Commons Attribution License (http://creativecommons.org/licenses/by/4.0/), which permits unrestricted use, distribution, and reproduction in any medium, provided the original work is properly cited.
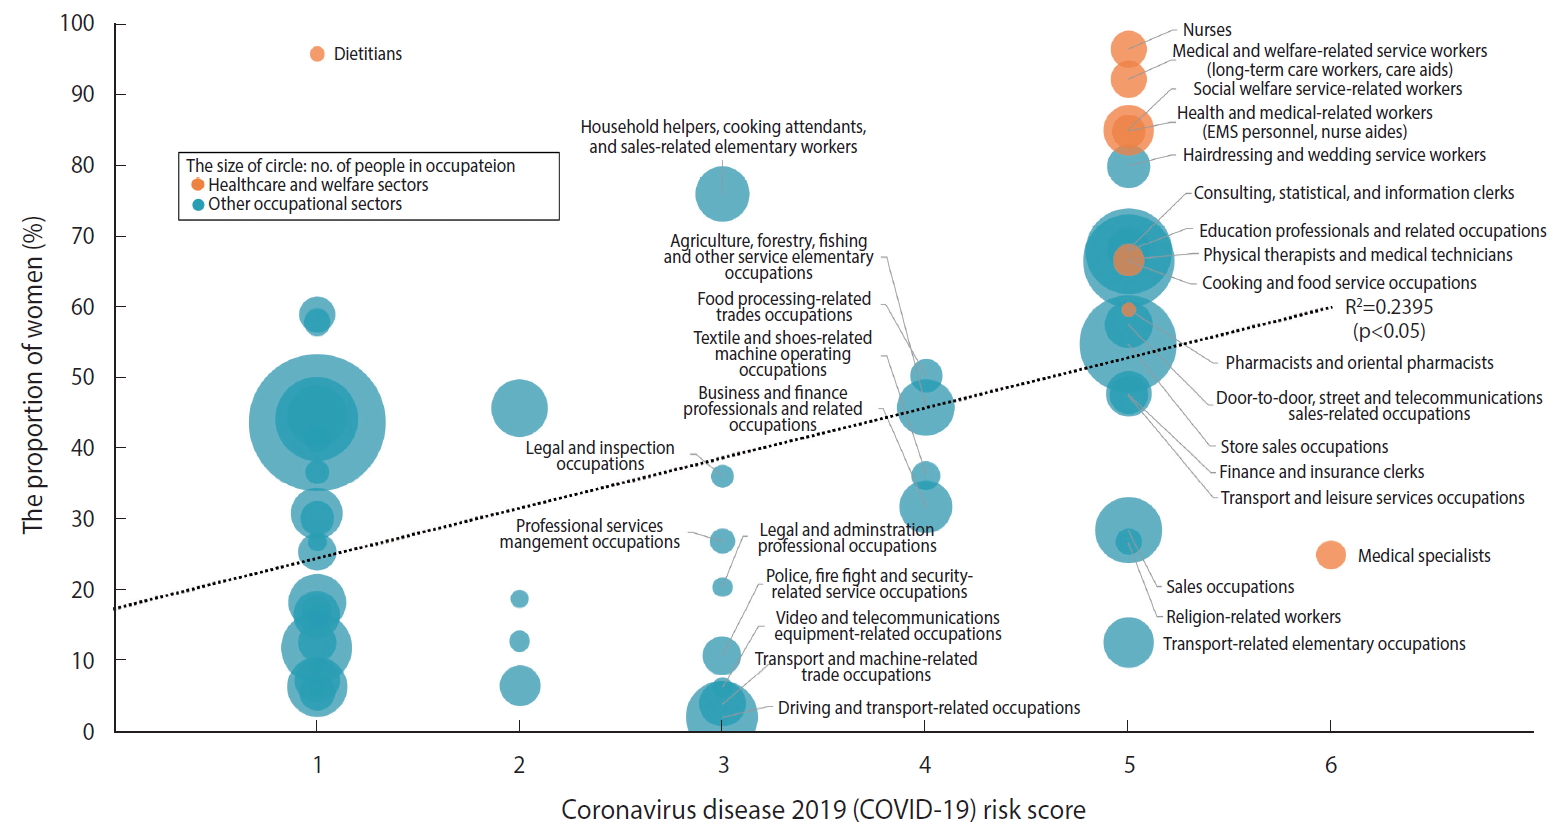
Sixth SOC codes | Risk score1 | Total, n2 | Women, n (%)2 | |
---|---|---|---|---|
Healthcare and welfare sectors (by 3-digit codes) | ||||
Medical specialists | 6 | 145,878 | 36,574 (25.1) | |
Pharmacists and oriental pharmacists | 5 | 35,541 | 21,232 (59.7) | |
Nurses | 5 | 227,168 | 219,301 (96.5) | |
Physical therapists and medical technician | 5 | 158,096 | 105,461 (66.7) | |
Health and medical-related workers (EMS personnel, nurse aides) | 5 | 186,996 | 158,775 (84.9) | |
Social welfare service-related workers | 5 | 430,185 | 366,009 (85.1) | |
Medical and welfare-related service workers (long-term care workers, care aides) | 5 | 222,830 | 205,581 (92.3) | |
Dietitians | 1 | 37,812 | 36,228 (95.8) | |
Other occupational sectors (by 2-digit codes) | ||||
Religion-related workers | 5 | 111,556 | 30,016 (26.9) | |
Education professionals and related occupations | 5 | 1,235,726 | 839,663 (67.9) | |
Finance and insurance clerks | 5 | 354,937 | 169,706 (47.8) | |
Consulting, statistical and information clerks and other clerks | 5 | 313,483 | 213,613 (68.1) | |
Hairdressing and wedding service workers | 5 | 308,603 | 246,724 (79.9) | |
Transport and leisure services occupations | 5 | 249,609 | 118,839 (47.6) | |
Cooking and food service occupations | 5 | 1,415,853 | 942,284 (66.6) | |
Sales occupations | 5 | 737,803 | 210,655 (28.6) | |
Store sales occupations | 5 | 1,576,184 | 865,985 (54.9) | |
Door to door, street and telecommunications sales-related occupations | 5 | 384,429 | 221,404 (57.6) | |
Transport-related elementary occupations | 5 | 426,099 | 54,186 (12.7) | |
Business and finance professionals and related occupations | 4 | 473,382 | 150,553 (31.8) | |
Food processing-related trades occupations | 4 | 178,102 | 89,709 (50.4) | |
Textile and shoes-related machine operating occupations | 4 | 138,160 | 50,227 (36.4) | |
Agriculture, forestry, fishing and other service elementary occupations | 4 | 544,583 | 249,937 (45.9) | |
Professional services management occupations | 3 | 109,368 | 29,549 (27.0) | |
Legal and administration professional occupations | 3 | 64,662 | 13,248 (20.5) | |
Legal and inspection occupations | 3 | 81,923 | 29,676 (36.2) | |
Police, fire fight and security-related service occupations | 3 | 245,764 | 26,676 (10.9) | |
Transport and machine-related trade occupations | 3 | 358,365 | 14,284 (4.0) | |
Video and telecommunications equipment-related occupations | 3 | 65,052 | 4,105 (6.3) | |
Driving and transport-related occupations | 3 | 868,592 | 17,887 (2.1) | |
Household helpers, cooking attendants, and sales-related elementary workers | 3 | 497,271 | 377,984 (76.0) | |
Sales and customer service managers | 2 | 54,666 | 10,288 (18.8) | |
Culture, arts and sports professionals and related occupations | 2 | 547,027 | 250,232 (45.7) | |
Wood and furniture, musical instrument and signboard-related trade occupations | 2 | 73,208 | 9,383 (12.8) | |
Electric and electronic-related trade occupations | 2 | 279,374 | 18,455 (6.6) | |
Administrative and business support management occupations | 1 | 74,630 | 12,263 (16.4) | |
Construction, electricity and production-related managers | 1 | 45,269 | 2,784 (6.1) | |
Science professionals and related occupations | 1 | 99,892 | 36,726 (36.8) | |
Information and communication professionals and technical occupations | 1 | 367,406 | 60,871 (16.6) | |
Engineering professionals and technical occupations | 1 | 846,303 | 100,155 (11.8) | |
Administration and accounting-related occupations | 1 | 3,171,132 | 1,387,086 (43.7) | |
Agricultural, livestock-related skilled occupations | 1 | 1,155,422 | 511,413 (44.3) | |
Skilled fishery occupations | 1 | 58,959 | 15,810 (26.8) | |
Textile, clothing and leather relates trade occupations | 1 | 221,280 | 130,616 (59.0) | |
Metal forming-related trade occupations | 1 | 218,049 | 12,228 (5.6) | |
Construction and mining-related trade occupations | 1 | 595,404 | 37,916 (6.4) | |
Other technical occupations | 1 | 148,804 | 25,515 (17.1) | |
Food processing-related operating occupations | 1 | 121,563 | 50,295 (41.4) | |
Chemical-related machine operating occupations | 1 | 239,152 | 61,025 (25.5) | |
Metal and non-metal-related operator occupations | 1 | 254,918 | 32,329 (12.7) | |
Machine production and related machine operators | 1 | 542,978 | 99,427 (18.3) | |
Electrical and electronic-related machine occupations | 1 | 440,371 | 136,174 (30.9) | |
Water treatment and recycling-related operating occupation | 1 | 37,583 | 3,572 (9.5) | |
Wood, printing and other machine operating occupations | 1 | 197,719 | 59,849 (30.3) | |
Construction and mining-related elementary occupations | 1 | 339,473 | 24,671 (7.3) | |
Production-related elementary occupations | 1 | 123,769 | 71,679 (57.9) | |
Clean and guard-related elementary occupations | 1 | 615,971 | 275,305 (44.7) | |
Skilled forestry occupations | 0 | 5,351 | 717 (13.4) |
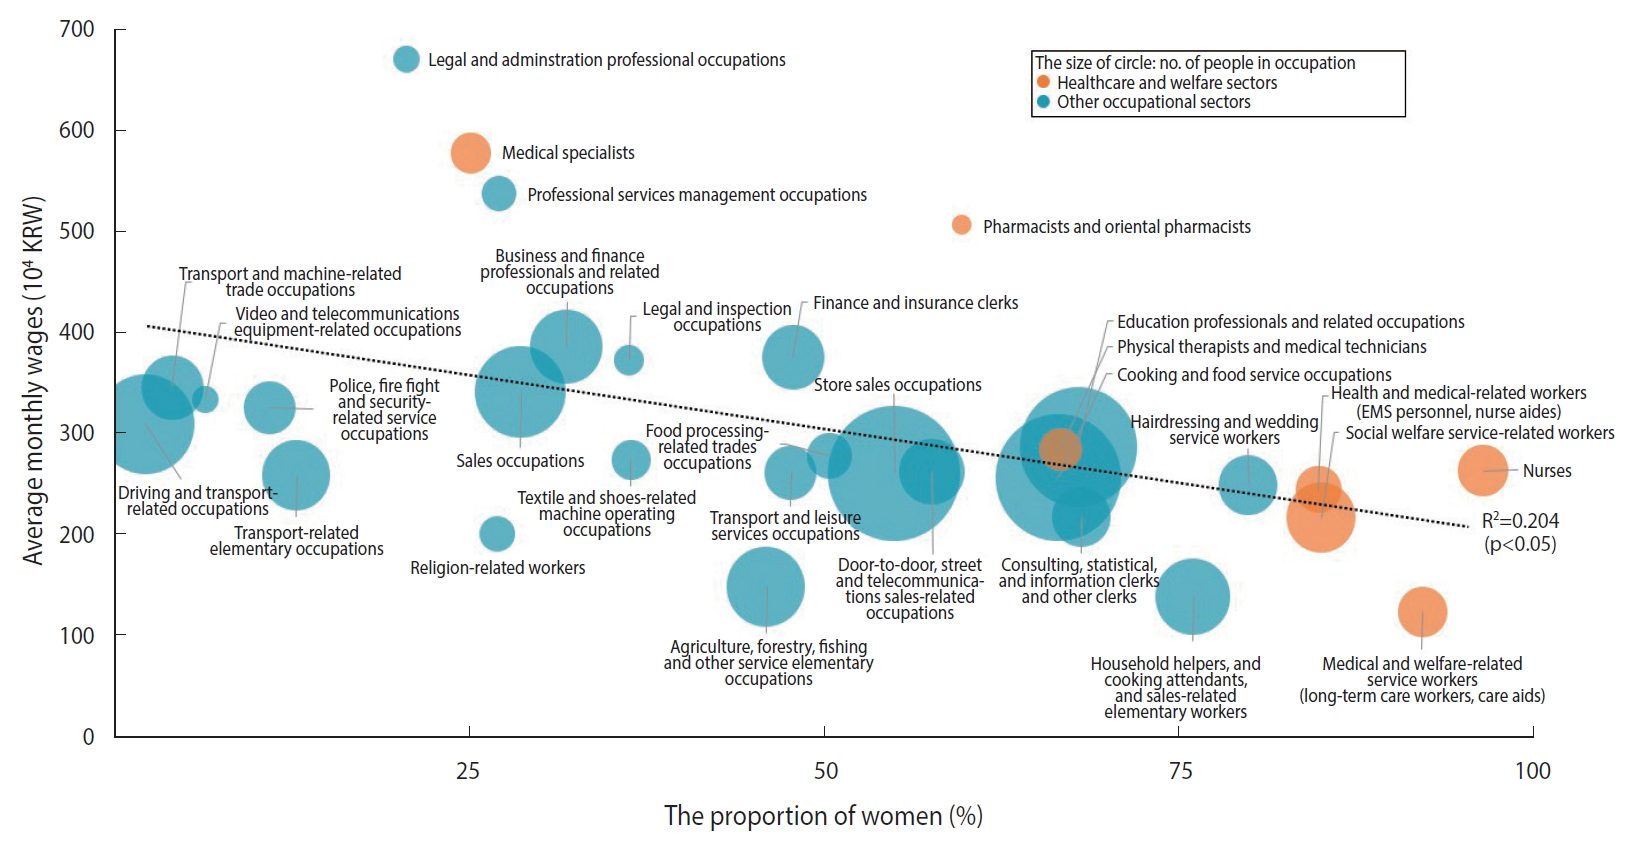
High-risk occupations | Total, n | Women, n (%)1 | Average monthly wages (104 KRW)2 | |
---|---|---|---|---|
Healthcare and welfare sectors (by 3-digit codes) | ||||
Medical specialists | 145,878 | 36,574 (25.1) | 581 | |
Pharmacists and oriental pharmacists | 35,541 | 21,232 (59.7) | 509 | |
Nurses | 227,168 | 219,301 (96.5) | 265 | |
Physical therapists and medical technicians | 158,096 | 105,461 (66.7) | 286 | |
Health and medical-related workers (EMS personnel, nurse aides) | 186,996 | 158,775 (84.9) | 246 | |
Social welfare service-related workers | 430,185 | 366,009 (85.1) | 218 | |
Medical and welfare-related service workers (long-term care workers, care aides) | 222,830 | 205,581 (92.3) | 124 | |
Total no. of employed in high-risk occupations | 1,406,694 | 1,112,933 (79.1) | ||
Other occupational sectors (by 2-digit codes) | ||||
Religion-related workers | 111,556 | 30,016 (26.9) | 202 | |
Education professionals and related occupations | 1,235,726 | 839,663 (67.9) | 288 | |
Finance and insurance clerks | 354,937 | 169,706 (47.8) | 378 | |
Consulting, statistical and information clerks and other clerks | 313,483 | 213,613 (68.1) | 219 | |
Hairdressing and wedding service workers | 308,603 | 246,724 (79.9) | 250 | |
Transport and leisure services occupations | 249,609 | 118,839 (47.6) | 263 | |
Cooking and food service occupations | 1,415,853 | 942,284 (66.6) | 258 | |
Sales occupations | 737,803 | 210,655 (28.6) | 343 | |
Store sales occupations | 1,576,184 | 865,985 (54.9) | 262 | |
Door-to-door, street and telecommunications sales-related occupations | 384,429 | 221,404 (57.6) | 264 | |
Transport-related elementary occupations | 426,099 | 54,186 (12.7) | 260 | |
Business and finance professionals and related occupations | 473,382 | 150,553 (31.8) | 388 | |
Food processing-related trades occupations | 178,102 | 89,709 (50.4) | 279 | |
Textile and shoes-related machine operating occupations | 138,160 | 50,227 (36.4) | 276 | |
Agriculture, forestry, fishing and other service elementary occupations | 544,583 | 249,937 (45.9) | 149 | |
Professional services management occupations | 109,368 | 29,549 (27.0) | 540 | |
Legal and administration professional occupations | 64,662 | 13,248 (20.5) | 674 | |
Legal and inspection occupations | 81,923 | 29,676 (36.2) | 374 | |
Police, fire fight and security-related service occupations | 245,764 | 26,676 (10.9) | 327 | |
Transport and machine-related trade occupations | 358,365 | 14,284 (4.0) | 347 | |
Video and telecommunications equipment-related occupations | 65,052 | 4,105 (6.3) | 336 | |
Driving and transport-related occupations | 868,592 | 17,887 (2.1) | 311 | |
Household helpers, cooking attendants, and sales-related elementary workers | 497,271 | 377,984 (76.0) | 139 | |
Total no. of employed in high-risk occupations | 10,739,506 | 4,966,910 (46.3) | - |
High-risk occupations | High-intensity exposure risk |
|||
---|---|---|---|---|
Total, %1 | Total, n2 | Women, n3 | ||
Healthcare and welfare sectors (by 3-digit codes) | ||||
Medical specialists | 17.7 | 25,844 | 6,480 | |
Pharmacists and oriental pharmacists | 1.7 | 593 | 354 | |
Nurses | 44.2 | 100,463 | 96,984 | |
Physical therapists and medical technicians | 31.3 | 49,437 | 32,978 | |
Health and medical-related workers (EMS personnel, nurse aides) | 32.7 | 61,200 | 51,964 | |
Social welfare service-related workers | 36.6 | 157,324 | 133,854 | |
Medical and welfare-related service workers (long-term care workers, care aides) | 68.6 | 152,944 | 141,105 | |
Total no. of workers exposed to high-intensity risk | 547,806 | 463,719 | ||
Other occupational sectors (by 2-digit codes) | ||||
Religion-related workers | 2.9 | 3,258 | 877 | |
Education professionals and related occupations | 9.2 | 113,390 | 77,047 | |
Finance and insurance clerks | 5.3 | 18,847 | 9,012 | |
Consulting, statistical and information clerks and other clerks | 5.8 | 18,152 | 12,369 | |
Hairdressing and wedding service workers | 12.4 | 38,222 | 30,558 | |
Transport and leisure services occupations | 8.0 | 19,854 | 9,452 | |
Cooking and food service occupations | 8.9 | 125,369 | 83,436 | |
Sales occupations | 4.5 | 33,154 | 9,466 | |
Store sales occupations | 8.6 | 135,031 | 74,188 | |
Door to door, street and telecommunications sales-related occupations | 7.3 | 27,901 | 16,069 | |
Transport-related elementary occupations | 12.6 | 53,556 | 6,811 | |
Business and finance professionals and related occupations | 5.0 | 23,633 | 7,516 | |
Food processing-related trades occupations | 12.1 | 21,585 | 10,872 | |
Textile and shoes-related machine operating occupations | 12.9 | 17,873 | 6,497 | |
Agriculture, forestry, fishing and other service elementary occupations | 7.3 | 39,591 | 18,170 | |
Professional services management occupations | 8.2 | 8,969 | 2,423 | |
Legal and administration professional occupations | 2.9 | 1,848 | 379 | |
Legal and inspection occupations | 4.3 | 3,485 | 1,262 | |
Police, fire fight and security-related service occupations | 25.1 | 61,740 | 6,701 | |
Transport and machine-related trade occupations | 13.2 | 47,471 | 1,892 | |
Video and telecommunications equipment-related occupations | 9.9 | 6,423 | 405 | |
Driving and transport-related occupations | 12.3 | 106,435 | 2,192 | |
Household helpers, cooking attendants, and sales-related elementary workers | 19.1 | 94,915 | 72,147 | |
Total no. of workers exposed to high-intensity risk | 1,020,704 | 459,744 |
Employment status | Total | Men | Women | |
---|---|---|---|---|
Healthcare and welfare sectors | ||||
Employers | 106,472 (6.1) | 71,984 (21.4) | 34,488 (2.4) | |
Self-employed | 41,606 (2.4) | 28,353 (8.4) | 13,253 (0.9) | |
Unpaid family workers | 4,104 (0.2) | 0 (0.0) | 4,104 (0.3) | |
Permanent workers | 1,356,084 (77.4) | 216,140 (64.2) | 1,139,944 (80.5) | |
Temporary workers | 202,193 (11.5) | 19,390 (5.8) | 182,803 (12.9) | |
Daily workers | 42,401 (2.4) | 621 (0.2) | 41,780 (2.9) | |
Total | 1,752,860 (100) | 336,488 (100) | 1,416,372 (100) | |
Other occupational sectors | ||||
Employers | 1,033,972 (8.2) | 704,234 (10.8) | 329,739 (5.4) | |
Self-employed | 2,651,095 (21.0) | 1,534,335 (23.5) | 1,116,760 (18.4) | |
Unpaid family workers | 506,650 (4.0) | 57,424 (0.9) | 449,226 (7.4) | |
Permanent workers | 6,406,690 (50.9) | 3,536,719 (54.2) | 2,869,970 (47.2) | |
Temporary workers | 1,603,717 (12.7) | 540,751 (8.3) | 1,062,966 (17.5) | |
Daily workers | 395,896 (3.1) | 146,284 (2.2) | 249,612 (4.1) | |
Total | 12,598,019 (100) | 6,519,747 (100) | 6,078,272 (100) |
Sectors | Employment statuses | Prevalence of protective resources, % |
||||
---|---|---|---|---|---|---|
Trade union, workers’ council, or a similar committee representing employees | Health and safety representative or committee | Safety management or team dealing with safety issues in the organization | A regular meeting in which employees can express their views about what is happening in the organisation | |||
Healthcare and welfare sectors | ||||||
Total | Permanent | 11.6 | 18.0 | 22.3 | 27.9 | |
Temporary | 4.7 | 9.8 | 15.1 | 19.0 | ||
Daily | 1.5 | 3.3 | 3.4 | 2.5 | ||
Men | Permanent | 12.5 | 18.5 | 24.5 | 31.4 | |
Temporary | 15.2 | 28.5 | 36.8 | 32.8 | ||
Daily | - | - | - | - | ||
Women | Permanent | 11.5 | 17.9 | 21.9 | 27.3 | |
Temporary | 3.5 | 7.8 | 12.7 | 17.5 | ||
Daily | 1.6 | 3.3 | 3.4 | 2.5 | ||
Other occupational sectors | ||||||
Total | Permanent | 16.7 | 14.7 | 21.1 | 27.6 | |
Temporary | 4.3 | 5.2 | 7.4 | 7.8 | ||
Daily | 2.0 | 3.7 | 5.2 | 5.7 | ||
Men | Permanent | 20.6 | 18.1 | 25.4 | 31.2 | |
Temporary | 6.9 | 6.7 | 9.2 | 8.1 | ||
Daily | 3.7 | 6.4 | 9.1 | 9.4 | ||
Women | Permanent | 12.0 | 10.6 | 15.7 | 23.3 | |
Temporary | 3.0 | 4.5 | 6.5 | 7.7 | ||
Daily | 1.0 | 2.2 | 3.0 | 3.6 |
SOC, Standard Occupational Classification; EMS, emergency medical service. Data from: 1The fifth Korean Working Conditions Survey (2017) and the weighted median score. 2The 20% sample of the 2015 census.
KRW, Korean won; EMS, emergency medical service. Data from: 1The 20% sample of the 2015 census. 2The fifth Korean Working Conditions Survey (2017); Sample weights were applied.
EMS, emergency medical service. Data from: 1The fifth Korean Working Conditions Survey (2017); The weighted prevalence of workers with high-intensity exposure risk. 2The estimated number of workers for each of the 30 high-risk occupations (see
Values are presented as number (%). Data from: The fifth Korean Working Conditions Survey (2017); Sample weights were applied.
Data from: The fifth Korean Working Conditions Survey (2017); Sample weights were applied.