Abstract
-
OBJECTIVES
- India still faces the burden of undernutrition and communicable diseases, and the prevalence of overweight/obesity is steadily increasing. The discourse regarding the dual burden of underweight and overweight/obesity has not yet been widely explored in both men and women. The present study assessed the determinants of underweight and overweight/obesity in India among adult men and women aged 15-49.
-
METHODS
- Population-based cross-sectional and nationally representative data from the National Family Health Survey-4 (2015-16), consisting of a sample of men and women, were analyzed. Stratified 2-stage sampling was used in the NFHS-4 study protocol. In the present study, bivariate and adjusted multinomial logistic regression analyses were performed to determine the correlates of underweight and overweight/obesity.
-
RESULTS
- The results suggested a persistently high prevalence of underweight coexisting with an increased prevalence of overweight/obesity in India. The risk of underweight was highest in the central and western regions and was also relatively high among those who used either smoking or smokeless tobacco. Overweight/obesity was more prevalent in urban areas, in the southern region, and among adults aged 35-49. Furthermore, level of education and wealth index were positively associated with overweight/obesity. More educated and wealthier adults were less likely to be underweight.
-
CONCLUSIONS
- In India, underweight has been prevalent, and the prevalence of overweight/obesity is increasing rapidly, particularly among men. The dual burden of underweight and overweight/obesity is alarming and needs to be considered; public health measures to address this situation must also be adopted through policy initiatives.
-
Keywords: Thinness, Overweight, Obesity, Nutritional status, Socioeconomic factors, India
INTRODUCTION
- The rising prevalence of overweight/obesity—coexisting with undernutrition—is a significant health challenge in low-income and middle-income countries. On one hand, improved economic conditions, urbanization, the prevalence of sedentary lifestyles, and dietary changes have caused a steady increase in overweight/obesity [1-3]. On the other hand, many South Asian and sub-Saharan African countries are also facing challenges posed by undernutrition and its consequences [4]. In India, the share of underweight adults is the highest globally, even as the country experiences an ongoing rise in overweight/obesity [4,5]. Similarly, other South Asian countries such as Bangladesh and Nepal have a high proportion of underweight adults, along with a growing prevalence of overweight/obesity [6,7]. The presence of underweight coexisting with a rising prevalence of overweight/obesity is defined as the dual burden of malnutrition, and it poses major health challenges among the adult populations of developing countries, including India.
- Both undernutrition and overnutrition are associated with adverse health outcomes. It is well-documented that overweight/obesity are significant predictors of overall mortality [8], chronic diseases such as diabetes [9], cardiovascular disease [10], multimorbidity [11,12], and disabilities [13]. Similarly, underweight is strongly associated with premature mortality, disabilities, and poor self-rated health and well-being, and this association is particularly strong in developing countries [14,15].
- The determinants of the dual burden of malnutrition differ considerably based on gender, socioeconomic, and behavioural factors. Economic status has emerged as an important determinant of overweight/obesity, particularly in developing countries [15-18]. In contrast, less educated and socially disadvantaged adults tend to be underweight [19,20]. Studies also suggest that several risk factors are associated with low and high body mass index (BMI), including physical inactivity, poor diet, and tobacco use [21-23].
- In India, few studies have examined the relationships among socioeconomic status (SES), tobacco use, dietary patterns, and BMI. Furthermore, most studies of BMI have focused on women respondents. However, it is also necessary to examine changing patterns in men’s body weight in order to understand the impact of modifiable health factors on men. Furthermore, considerable variations in BMI have been noted across states in India [24,25], as these states exhibit diverse and unequal patterns of economic development, and demographic and epidemiological transitions are occurring differently across different regions [26,27]. Therefore, it is necessary to understand the existence of the dual burden of undernutrition and overnutrition among the population (men and women) of India. In this context, the present study assesses the determinants of underweight and overweight/obesity in India for both men and women.
MATERIALS AND METHODS
- Data source
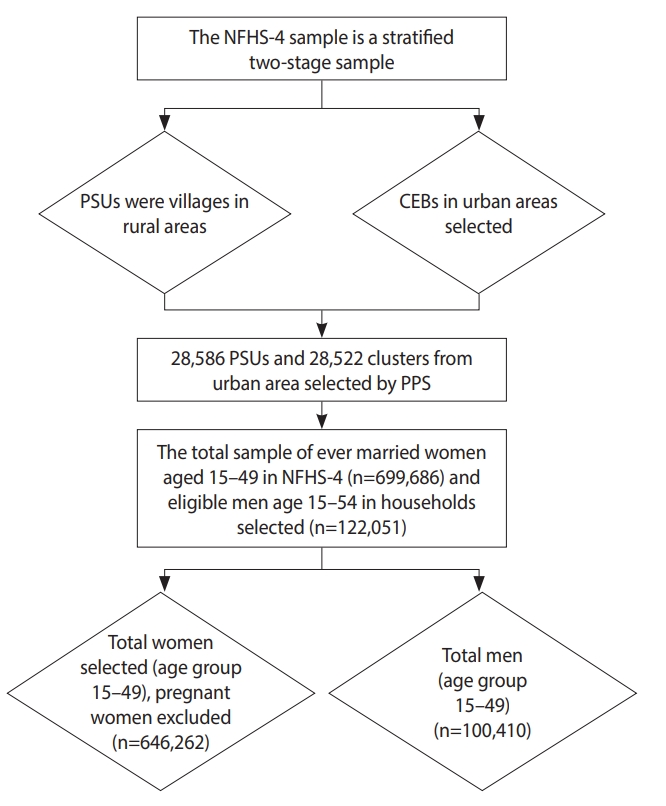
- The present study used data from the National Family Health Survey (NFHS-4), the fourth in the series of NFHS. The survey was conducted in 2015-16 and obtained information about population, nutrition, and health for the states of India and for the country as a whole. The NFHS-4 was conducted by interviewing randomly-selected women aged 15-49 and men aged 15-54. Stratified 2-stage sampling was used as the sampling design for the NFHS-4 study. In the first stage, the primary sampling units were selected, and in the second stage, the households for the study were selected. Primary sampling units with at least 300 households were divided into segments of approximately 100-150 households. Two of the segments were selected using systematic sampling with probability proportional to size. From each selected rural and urban cluster, 22 households were selected using systematic sampling (Figure 1).
- Measures
Dependent variable
- BMI is defined as the individual’s weight in kilograms divided by the square of the individual’s height in meters (kg/m2). In this study, objectively measured height and weight were used to calculate BMI. We followed World Health Organization standards for the categorisation of BMI. Subjects were categorised into the following 3 groups according to BMI: underweight, less than 18.5 kg/m2; normal, between 18.5 and 24.9 kg/m2; and overweight/obesity, equal to or greater than 25.0 kg/m2 [28].
Predictor variables
- The study population was categorised into 4 groups by education level: no education, primary education, secondary education, and more than secondary education.
- The wealth index was calculated using the number and type of consumer goods owned by a household, as well as housing characteristics. Each household asset was allocated a weight or factor score measure through principal component analysis, and values were standardized in relation to a normal distribution. The sample was then divided into quintiles: poorest, poorer, middle, richer, and richest.
- Subjects were categorised into 4 groups according to their tobacco use: no tobacco, only smoking tobacco (cigarettes, bidis, cigars, or hookah pipes), only smokeless tobacco (paan masala or gutkha, khaini, paan with tobacco, any other type of chewing tobacco, or snuff), and both smoking and smokeless tobacco.
- To identify the impact of food consumption on underweight and overweight/obesity, the frequency of intake of various food items was obtained. Respondents could rate their food intake of each item as never, occasionally, or daily.
- The regions of India were divided into 6 categories: northern, central, eastern, western, northeastern, and southern. The northern region consisted of Chandigarh, Delhi, Haryana, Himachal Pradesh, Jammu and Kashmir, Punjab, Rajasthan, and Uttarakhand. The central region included Chhattisgarh, Madhya Pradesh, and Uttar Pradesh, and the eastern region included Jharkhand, Odisha, West Bengal, and Bihar. The northeastern region included Nagaland, Sikkim, Arunachal Pradesh, Manipur, Mizoram, Tripura, Meghalaya, and Assam; the western region included Dadra and Nagar Haveli, Daman and Diu, Gujarat, Maharashtra, and Goa. Lastly, the southern region consisted of Andaman and Nicobar Islands, Andhra Pradesh, Karnataka, Kerala, Tamil Nadu, Telangana, Puducherry, and Lakshadweep.
Covariates
- The selected covariates included age group (15-19, 20-34, and 35-49), place of residence (rural or urban), caste (Scheduled Caste, Scheduled Tribe, Other Backward Class, or other), religion (Hindu, Muslim, or other), currently employed (no or yes), and marital status (unmarried, currently married, widowed, or divorced/separated).
- Statistical analysis
- In this study, bivariate analysis was performed to determine the relationship of background characteristics with the weighted prevalence of underweight and overweight/obesity. State-level differences in underweight and overweight/obesity were also assessed. In addition, multinomial logistic regression analysis was used to evaluate the determinants of underweight and overweight/obesity. Relative risk (RR) ratios were presented with confidence intervals (CIs). Moreover, separate analyses were conducted for men and women. The analysis was restricted to women aged 15-49 who were not pregnant and who had not given birth within 2 months prior to the survey (n=646,262) and men aged 15-49 (n=100,410). All data analysis was carried out using Stata version 14.0 (StataCorp., College Station, TX, USA).
- Ethics statement
- This research does not have an ethical code because the data source used in this study gathered from publically available data and these data considered as secondary data.
RESULTS
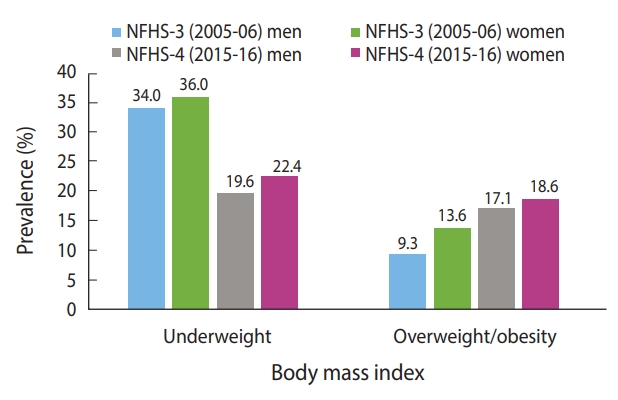
- During the study period, the prevalence of underweight decreased and the prevalence of overweight/obesity increased among both men and women (Figure 2). The prevalence of both underweight and overweight/obesity were higher among women than men. The prevalence of overweight/obesity among men almost doubled from 2005-06 to 2015-16.
-
Figure 3A and 3B shows the distribution of underweight and overweight/obesity among men in different Indian states. Among men, a higher prevalence of underweight was clustered in Uttar Pradesh, Bihar, and Madhya Pradesh. In contrast, the prevalence was low in the southern and northern regions, as well as in some of the northeastern region. A high prevalence of overweight/obesity was found in Goa, Andhra Pradesh, and Sikkim, where more than 30% of men were overweight/obese; this was followed by Kerala, Tamil Nadu, and Punjab, where 25% to 30% of men were found to be overweight/obese. Telangana was the state with the most similar prevalence (20 to 25%) of underweight and overweight/obesity.
-
Figure 3C and 3D shows the prevalence of underweight and overweight/obesity among women in the Indian states. Bihar and Jharkhand displayed a higher prevalence of underweight than the other states. Furthermore, a relatively high risk of underweight was found to cluster in the middle part of India, including Rajasthan, Gujarat, Madhya Pradesh, Chhattisgarh, Odisha, Uttar Pradesh, and Assam. Figure 3D shows a lower prevalence of overweight/obesity in the abovementioned states. Overweight/obesity was found to be highly clustered in the southern states of India. In addition, Punjab, Goa, and Delhi displayed a high prevalence of overweight/obesity. Maharashtra and Karnataka showed a similar prevalence for both underweight and overweight/obesity.
-
Table 1 illustrates the prevalence, by percentage, of underweight and overweight/obesity depending on background characteristics. The prevalence of underweight was highest among men and women in the 15-year to 19-year age group, while overweight/obesity was highest among men and women aged 35-49 years. The prevalence of overweight/obesity was highest in the southern region for both men and women. Underweight was more prevalent in rural areas, whereas overweight/obesity was higher in urban areas. The prevalence of underweight was highest among Scheduled Tribe members, Hindus, those who had never married, those who were less educated, and those in the poorest quintile for both men and women. The prevalence of overweight/obesity was highest among men and women belonging to “other” castes and religions, those with more than a secondary education, those with a high wealth index, and non-tobacco consumers. Unemployed men were more likely than employed men to be underweight, but the employment status of women did not make a significant difference in the prevalence of underweight. Moreover, the prevalence of overweight/obesity was higher among employed than unemployed men, but the reverse was true for women. The prevalence of underweight and overweight/obesity according to food consumption is shown in Table 2. As shown in the Table 3, individuals were typically more likely to be overweight/obesity if the assessed foods were consumed daily, whereas underweight was more prevalent if the foods were never consumed. The estimated predictive power of food consumption for underweight and overweight/obesity risk is presented in Table 4.
- Estimates of multinomial logistic regression to identify factors affecting body mass index in India (National Family Health Survey 2015-16)
- The factors affecting underweight and overweight/obesity in men and women according to background characteristics are shown in Table 3. The likelihood of being underweight decreased as age increased, while the likelihood of overweight/obesity tended to increase with age among both men and women. Men aged 35-49 years were 3.15 times more likely to be overweight/obese than man subjects aged 15-19 years. Similarly, women aged 35-49 were 4.52 times more likely to be overweight/obese than woman respondents aged 15-19 years. Compared to northern region, men in all regions except for the central region were more likely to be overweight/obese. In contrast, the likelihood of overweight/obesity was higher among women in the western, and southern regions than among women in the northern region. Men who lived in urban areas were 1.18 times more likely to be overweight/obese than men residing in rural regions. Women in urban areas were 10.5% less likely to be underweight and 1.28 times more likely to be overweight/obese than women living in rural areas. Regarding caste, Scheduled Tribe members were least likely to be overweight/obese, whereas people of “other” castes were most likely to be overweight/obese for both men and women.
- Men who were currently employed were less likely than unemployed men to be underweight, and employed women were less likely than unemployed women to be overweight/obesity. Furthermore, with regard to marriage status, married men and women were least likely to be underweight, and the likelihood of being overweight/obesity was much higher in this group than in other groups. As education level increased, the prevalence of underweight tended to decrease, while the prevalence of overweight/obesity tended to increase. Compared to less wealthy individuals, individuals with a higher wealth index were more likely to be overweight/obesity and less likely to be underweight. Those in the highest wealth quintile for men and women were 5.10 and 5.63 times more likely than those in the lowest wealth quintile, respectively, to be overweight/obese. The use of tobacco increased the likelihood of underweight among both men and women, but it decreased the likelihood of overweight/obesity.
- The likelihood of underweight decreased with occasional and daily consumption of milk among men, while among women, it decreased with daily milk consumption (Table 4). Further, the occasional and daily consumption of pulses decreased the likelihood of overweight/obesity among women. In addition, the occasional and daily intake of vegetables and fruit decreased the risk of underweight among women. However, the daily intake of fruit was associated with increased risk of overweight/obesity among men. The occasional consumption of fish increases the risk of overweight/obesity. Moreover, the daily and occasional intake of aerated drinks significantly increased the risk of overweight/obesity among men and women.
DISCUSSION
- Using recent data from the NFHS-4, this study examined the determinants of undernutrition and overnutrition among adult men and women aged 15-49 in India. In particular, the aim was to understand the association of SES, diet, and tobacco use on underweight and overweight/obesity. We additionally studied variations in BMI across the states of India.
- We noticed a sharp rise in the prevalence of overweight/obesity between 2005-2006 and 2015-2016. Nevertheless, the proportion of men (19.6%) and women (22.4%) studied who were underweight, thus suggesting the presence of the dual burden of malnutrition among the adult population in India. It was also found that underweight was prevalent in most of the Empowered Action Group states, which are states that lag behind in various demographic and social indicators. However, the southern states displayed a high prevalence of overweight/obesity. Further, the prevalence of underweight and overweight/obesity was found to be dependent on SES. In particular, the association between wealth quintile and overweight/obesity was highly significant and positive for men and women. The highest percentage of underweight subjects was observed among adults with the poorest SES.
- The results of this study are consistent with previous findings that showed a higher prevalence of underweight among adults with low SES [20]. Similarly, overweight is more prevalent among educated and wealthier people [16-18]. Previous studies conducted in India have identified SES as an important factor involved in access to food, which can influence body weight. Higher SES also appears to be strongly correlated with physical inactivity, which subsequently plays an important role in determining body weight [16]. Additionally, gender differences in BMI are notable. Though the prevalence of obesity was higher among women respondents, the gender gap in overweight/obesity is gradually declining. The gender differences in overweight/obesity in India can be attributed to health risk factors, such as lower physical activity (PA) among women respondents [21].
- In this study, tobacco use was found to be significantly associated with BMI. This association was positive with underweight and negative with overweight/obesity, and the results are in line with those of previous studies conducted in India [22,23]. The strength of the association between tobacco use and underweight has been found to be stronger for women respondents than men. The existing literature has identified tobacco use as a main cause of appetite suppression, which is reflected in reduced food intake and lower BMI [29-31]. Tobacco is smoked more commonly by adults of low SES, which raises concern about tobacco use, as it has shown a strong association with various adverse health outcomes, including mortality.
- Behavioural risk factors, such as the intake of milk/curd, vegetables, fruit, fish, eggs, and aerated drinks, were found to be associated with BMI. The previous literature has shown that frequent consumption of vegetables and dairy products is positively associated with BMI [1]. The consumption of pulses, milk, and vegetables has been shown to reduce the risk of underweight, and high consumption of fish and aerated drinks increases the risk of overweight/obesity [32].
- The coexistence of underweight and overweight/obesity in developing countries like India calls for attention. Proactive measures to prevent underweight and overweight/obesity are important. The results from this study strongly suggest that overweight/obesity is prevalent among adults of higher SES, thus suggesting possible measures to promote changes in dietary patterns and PA. In this study, tobacco use emerged as a significant factor in determining BMI, and the prevalence of tobacco use is high in India. In this context, creating awareness about the implications of tobacco use for nutritional status is important. Furthermore, measures to promote PA are also important. In India, more than half of adults aged 20 or above are physically inactive [21]. In particular, women are at a higher risk than men of being inactive. In this context, measures to promote PA will have significant implications for reducing the burden of overweight/obesity and chronic conditions. In future research, the reasons for low levels of PA in women, the reasons why high-income people tend to be overweight/obese, and public health strategies to address these problems should be investigated.
- The limitations of this study include the cross-sectional nature of the data used. Therefore, no causal relationships can be established. Furthermore, we used only underweight and overweight/obesity as measures of nutritional status. Additionally, NFHS provides no information on several other risk factors for underweight and overweight/obesity, such as PA, sleep patterns, and amount of stress.
- However, the main strength of this study is that the data used were large-scale and nationally representative. Therefore, the results of this study can be generalized to the national level. Furthermore, most of the previous literature has focused mainly on correlates of BMI for women of reproductive age. This study provided information on the prevalence of underweight and overweight/ obesity across the states of India for both men and women and their major correlates.
- The findings suggest that the dual burden of malnourishment persists in India. Underweight is already prevalent in India, and the prevalence of overweight/obesity is increasing rapidly, particularly among men. The study further showed a high clustering of underweight in most of the Empowered Action Group states, whereas overweight/obesity was mostly clustered in the southern states. The results of this study suggest significant associations between socioeconomic variables and underweight. The major risk factor for underweight was found to be tobacco use; in particular, the use of smoking tobacco was associated with underweight status. However, adults aged 35-49, those residing in the northeastern region, those who were currently employed and more highly educated, and those who had a higher wealth index were at lower risks of being underweight. In contrast, older adults, those residing in the western and southern regions, those residing in urban areas, and more educated and wealthier individuals were more prone to being overweight/obese. We found little difference in the risk factors for underweight and overweight/obesity with respect to gender in India. The dual burden of underweight and overweight/obesity is alarming and must be taken into consideration so that public health measures can be implemented through policy initiatives. From this perspective, measures to prevent tobacco use and overweight/obesity-related interventions may enhance the nutritional status of the adult population in India.
NOTES
-
The authors have no conflicts of interest to declare for this study.
-
AUTHOR CONTRIBUTIONS
Conceptualization: YS, MD, PS. Data curation: MD. Formal analysis: MD, LP, YS. Funding acquisition: None. Methodology: MD, YS, PS. Visualization: MD, YS, LP. Writing – original draft: MD, YS, PS, LP. Writing – review & editing: MD, YS, PS, LP.
ACKNOWLEDGEMENTS
None.
Figure 1.Flow chart for the sampling and sample selection, NFHS-4, 2015/16, India. NFHS, National Family Health Survey; PSUs, primary sampling units; CEB, census enumeration block; PPS, probability proportional to size.

Figure 2.Distribution of underweight and overweight/obesity among men and women in India, National Family Health Survey (NFHS)- 2005/06-2015/16.

Figure 3.Distribution of underweight and overweight/obesity among men (A, B) and women (C, D) across the states of India, National Family Health Survey-4, 2015/16, India.
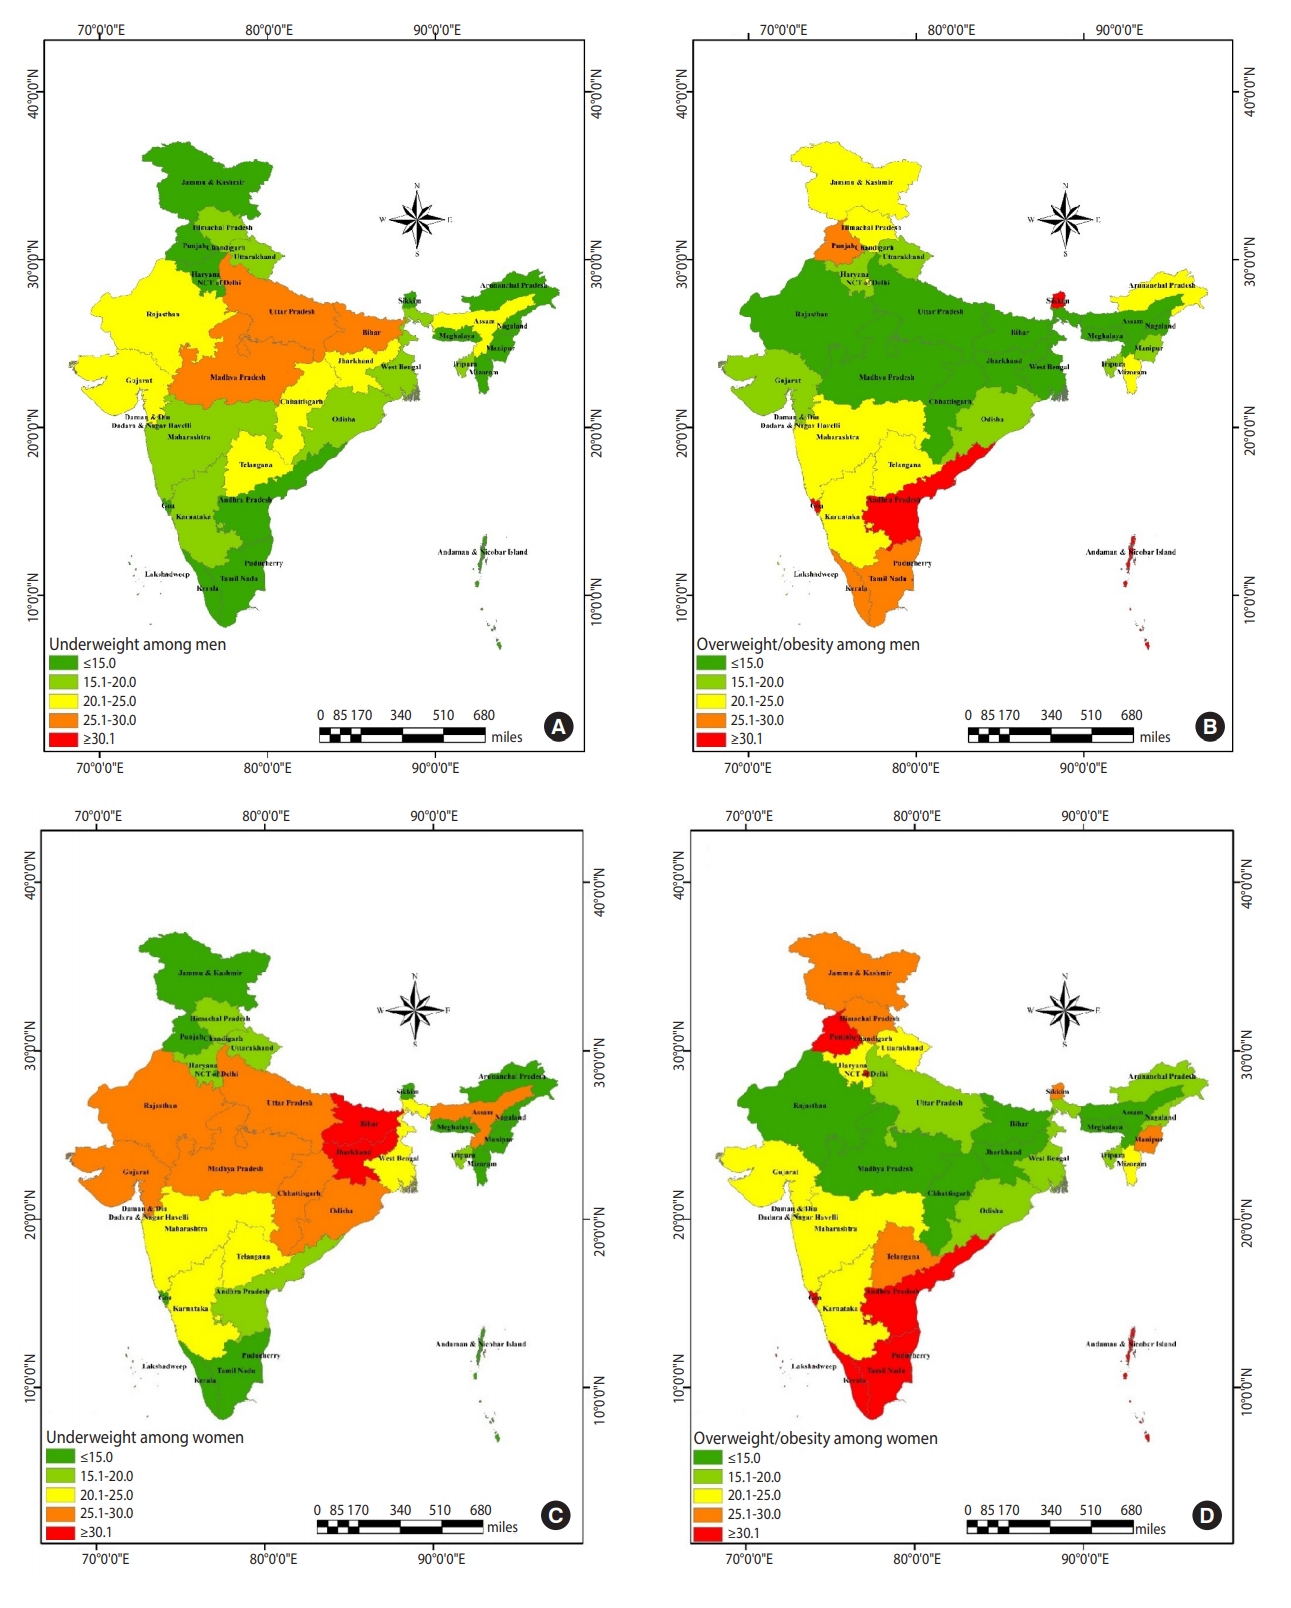
Table 1.Distribution of underweight and overweight/obesity by socioeconomic characteristics, NFHS-4, 2015-16, India
|
Characteristics1
|
Men, %
|
Women, %
|
|
Underweight |
Overweight/obesity |
Total (n) |
Underweight |
Overweight/ obesity |
Total (n) |
|
Age (yr)***
|
|
|
|
|
|
|
|
15-19 |
44.9 |
4.8 |
18,493 |
42.0 |
4.3 |
117,924 |
|
20-34 |
16.6 |
17.7 |
45,927 |
22.8 |
17.9 |
294,396 |
|
35-49 |
12.3 |
27.6 |
35,990 |
14.0 |
32.2 |
233,942 |
|
Region***
|
|
|
|
|
|
|
|
Northern |
16.5 |
19.5 |
22,161 |
19.4 |
22.2 |
129,946 |
|
Central |
26.4 |
11.9 |
25,446 |
26.4 |
15.4 |
170,828 |
|
Eastern |
22.2 |
13.8 |
15,433 |
26.7 |
15.4 |
116,030 |
|
Western |
21.3 |
22.3 |
10,901 |
24.7 |
23.7 |
52,276 |
|
Northeastern |
18.2 |
14.0 |
12,922 |
22.0 |
14.7 |
91,146 |
|
Southern |
14.2 |
27.5 |
13,547 |
17.0 |
29.7 |
86,036 |
|
Place of residence***
|
|
|
|
|
|
|
|
Rural |
23.0 |
14.3 |
69,022 |
26.8 |
15.1 |
456,728 |
|
Urban |
15.5 |
26.6 |
31,388 |
15.5 |
31.4 |
189,534 |
|
Caste***
|
|
|
|
|
|
|
|
SC |
22.9 |
15.0 |
17,963 |
25.3 |
17.3 |
114,935 |
|
ST |
25.1 |
9.8 |
17,887 |
31.8 |
10.1 |
116,898 |
|
OBC |
20.3 |
19.6 |
39,059 |
23.0 |
20.9 |
253,061 |
|
Other |
16.6 |
24.7 |
19,919 |
17.8 |
27.4 |
131,157 |
|
Religion***
|
|
|
|
|
|
|
|
Hindu |
20.7 |
18.4 |
74,920 |
23.6 |
19.9 |
480,743 |
|
Muslim |
19.3 |
19.9 |
13,886 |
21.6 |
23.7 |
86,135 |
|
Other |
13.9 |
24.5 |
11,604 |
16.4 |
26.5 |
79,384 |
|
Currently employed***
|
|
|
|
|
|
|
|
No |
32.8 |
11.1 |
25,772 |
22.7 |
22.2 |
85,597 |
|
Yes |
16.1 |
21.5 |
74,638 |
22.7 |
20.6 |
27,239 |
|
Marital status***
|
|
|
|
|
|
|
|
Never married |
30.7 |
10.2 |
38,688 |
37.4 |
6.6 |
167,696 |
|
Married |
13.6 |
24.5 |
60,458 |
18.4 |
25.2 |
450,995 |
|
Widowed |
24.2 |
13.5 |
577 |
18.1 |
26.5 |
20,000 |
|
Divorced/separated |
22.3 |
15.4 |
687 |
20.2 |
22.7 |
7,571 |
|
Education level***
|
|
|
|
|
|
|
|
Not educated |
22.6 |
12.0 |
12,251 |
24.7 |
16.9 |
183,128 |
|
Up to primary |
21.7 |
16.4 |
12,335 |
22.0 |
21.8 |
81,509 |
|
Up to secondary |
22.3 |
18.0 |
59,890 |
24.0 |
21.4 |
308,908 |
|
More than secondary |
10.4 |
28.5 |
15,934 |
16.0 |
25.9 |
72,717 |
|
Wealth index***
|
|
|
|
|
|
|
|
Poorest |
31.9 |
4.8 |
16,639 |
36.0 |
5.9 |
121,389 |
|
Poorer |
26.6 |
9.8 |
21,039 |
29.6 |
11.4 |
137,673 |
|
Middle |
20.5 |
16.6 |
21,970 |
23.1 |
18.8 |
136,665 |
|
Richer |
16.2 |
24.4 |
20,798 |
17.1 |
28.2 |
129,062 |
|
Richest |
10.6 |
32.7 |
19,964 |
11.6 |
36.2 |
121,473 |
|
Tobacco use***
|
|
|
|
|
|
|
|
No tobacco |
20.9 |
21.0 |
51,663 |
22.5 |
21.2 |
577,413 |
|
Only smoking tobacco |
16.6 |
19.2 |
15,473 |
31.9 |
12.2 |
5,462 |
|
Only smokeless tobacco |
20.8 |
15.7 |
22,335 |
28.4 |
15.0 |
60,988 |
|
Both smoking and smokeless tobacco |
20.1 |
13.2 |
10,939 |
26.1 |
13.0 |
2,399 |
Table 2.Distribution of underweight and overweight/obesity by food consumption, NFHS-4, 2015-16, India
|
Food consumption1
|
Men, %
|
Women, %
|
|
Underweight |
Overweight/ obesity |
Total (n) |
Underweight |
Overweight/ obesity |
Total (n) |
|
Milk/curd***
|
|
|
|
|
|
|
|
Never |
26.3 |
12.8 |
6,045 |
27.7 |
17.8 |
55,707 |
|
Occasionally |
22.6 |
16.0 |
51,468 |
25.9 |
17.2 |
332,412 |
|
Daily |
17.0 |
22.7 |
42,897 |
19.0 |
25.0 |
258,143 |
|
Pulses***
|
|
|
|
|
|
|
|
Never |
21.7 |
14.6 |
456 |
28.9 |
19.9 |
3,586 |
|
Occasionally |
21.2 |
17.9 |
55,127 |
23.7 |
19.9 |
367,030 |
|
Daily |
19.0 |
20.1 |
44,827 |
21.9 |
21.8 |
275,646 |
|
Vegetables***
|
|
|
|
|
|
|
|
Never |
25.6 |
12.9 |
418 |
30.6 |
16.8 |
2,117 |
|
Occasionally |
21.5 |
18.0 |
52,730 |
23.9 |
20.0 |
326,903 |
|
Daily |
18.6 |
20.1 |
47,262 |
21.8 |
21.7 |
317,242 |
|
Fruits***
|
|
|
|
|
|
|
|
Never |
26.9 |
9.9 |
2015 |
30.1 |
14.0 |
15,451 |
|
Occasionally |
20.8 |
18.0 |
88,024 |
23.9 |
19.4 |
563,351 |
|
Daily |
14.2 |
28.4 |
10,371 |
14.5 |
31.8 |
67,460 |
|
Eggs***
|
|
|
|
|
|
|
|
Never |
21.4 |
18.7 |
20,378 |
23.2 |
20.8 |
19,825 |
|
Occasionally |
20.1 |
18.6 |
75,671 |
23.1 |
20.3 |
429,937 |
|
Daily |
16.5 |
24.3 |
4,361 |
17.7 |
27.7 |
20,500 |
|
Fish***
|
|
|
|
|
|
|
|
Never |
21.2 |
18.3 |
28,481 |
23.3 |
20.5 |
233,755 |
|
Occasionally |
20.2 |
18.9 |
67,796 |
23.5 |
20.3 |
385,262 |
|
Daily |
13.6 |
23.4 |
433 |
14.6 |
27.6 |
27,245 |
|
Chicken***
|
|
|
|
|
|
|
|
Never |
21.2 |
18.3 |
23 521 |
23.1 |
20.6 |
211,694 |
|
Occasionally |
19.9 |
19.1 |
75 153 |
23.0 |
20.7 |
426,757 |
|
Daily |
18.8 |
21.0 |
1736 |
17.7 |
28.0 |
7,811 |
|
Fried food***
|
|
|
|
|
|
|
|
Never |
19.5 |
20.2 |
7,659 |
22.1 |
24.1 |
29,181 |
|
Occasionally |
20.3 |
18.9 |
81,140 |
23.1 |
20.5 |
540,818 |
|
Daily |
19.8 |
18.1 |
11,611 |
21.7 |
21.0 |
76,263 |
|
Aerated drinks***
|
|
|
|
|
|
|
|
Never |
21.0 |
16.2 |
12,549 |
25.9 |
17.8 |
106,120 |
|
Occasionally |
20.3 |
19.0 |
81,401 |
22.5 |
21.3 |
509,147 |
|
Daily |
17.2 |
22.8 |
6,460 |
20.3 |
22.3 |
30,995 |
Table 3.Adjusted relative risk ratio of underweight and overweight/obesity by socioeconomic characteristics as determined through multinomial logistic regression analysis, NFHS-4, 2015-16, India1
|
Characteristics |
Men
|
Women
|
|
Underweight |
Overweight/obesity |
Underweight |
Overweight/obesity |
|
Age (yr) |
|
|
|
|
|
15-19 |
1.00 (reference) |
1.00 (reference) |
1.00 (reference) |
1.00 (reference) |
|
20-34 |
0.40 (0.38, 0.42)***
|
2.14 (1.95, 2.34)***
|
0.68 (0.65, 0.72)***
|
2.30 (2.10, 2.53)***
|
|
35-49 |
0.34 (0.32, 0.37)***
|
3.15 (2.85, 3.48)***
|
0.44 (0.41, 0.47)***
|
4.52 (4.11, 4.98)***
|
|
Region |
|
|
|
|
|
Northern |
1.00 (reference) |
1.00 (reference) |
1.00 (reference) |
1.00 (reference) |
|
Central |
1.32 (1.25, 1.40)***
|
0.89 (0.83, 0.94)***
|
1.08 (1.02, 1.13)***
|
0.99 (0.93, 1.04) |
|
Eastern |
1.04 (0.98, 1.11) |
1.17 (1.09, 1.26)***
|
1.15 (1.09, 1.22)***
|
1.06 (0.98, 1.13) |
|
Western |
1.58 (1.48, 1.70)***
|
1.22 (1.14, 1.31)***
|
1.62 (1.52, 1.72)***
|
1.14 (1.07, 1.22)***
|
|
Northeastern |
0.65 (0.60, 0.71)***
|
1.29 (1.19, 1.40)***
|
0.60 (0.55, 0.65)***
|
1.06 (0.98, 1.15) |
|
Southern |
0.98 (0.91, 1.05) |
1.57 (1.47, 1.68)***
|
1.07 (1.00, 1.14)**
|
1.44 (1.36, 1.54)***
|
|
Place of residence |
|
|
|
|
|
Rural |
1.00 (reference) |
1.00 (reference) |
1.00 (reference) |
1.00 (reference) |
|
Urban |
1.01 (0.96, 1.05) |
1.18 (1.13, 1.23)***
|
0.89 (0.85, 0.93)***
|
1.28 (1.23, 1.33)***
|
|
Caste |
|
|
|
|
|
SC |
1.00 (reference) |
1.00 (reference) |
1.00 (reference) |
1.00 (reference) |
|
ST |
0.79 (0.75, 0.84)***
|
0.83 (0.77, 0.90)***
|
0.974 (0.92, 1.03) |
0.76 (0.71, 0.81)***
|
|
OBC |
0.97 (0.92, 1.01) |
1.07 (1.01, 1.13)**
|
0.967 (0.93, 1.01) |
1.02 (0.97, 1.07) |
|
Other |
0.87 (0.82, 0.92)***
|
1.22 (1.15, 1.30)***
|
0.88 (0.83, 0.93)***
|
1.13 (1.07, 1.20)***
|
|
Religion |
|
|
|
|
|
Hindu |
1.00 (reference) |
1.00 (reference) |
1.00 (reference) |
1.00 (reference) |
|
Muslim |
0.93 (0.88, 0.99)**
|
0.99 (0.93, 1.06) |
0.91 (0.86, 0.96)***
|
1.29 (1.22, 1.37)***
|
|
Other |
0.69 (0.63, 0.74)***
|
1.15 (1.07, 1.23)***
|
0.60 (0.56, 0.64)***
|
1.09 (1.02,1.16)***
|
|
Currently employed |
|
|
|
|
|
No |
1.00 (reference) |
1.00 (reference) |
1.00 (reference) |
1.00 (reference) |
|
Yes |
0.72 (0.69, 0.75)***
|
1.00 (0.94, 1.06) |
0.96 (0.93, 1.00)**
|
0.93 (0.89, 0.97)***
|
|
Marital status |
|
|
|
|
|
Never married |
1.00 (reference) |
1.00 (reference) |
1.00 (reference) |
1.00 (reference) |
|
Married |
0.76 (0.72, 0.80)***
|
1.91 (1.80, 2.02)***
|
0.64 (0.61, 0.67)***
|
2.19 (2.05, 2.34)***
|
|
Widowed |
1.14 (0.92, 1.41) |
1.34 (1.02, 1.78)**
|
0.69 (0.62, 0.77)***
|
2.00 (1.79, 2.23)***
|
|
Divorced/separated |
1.06 (0.86, 1.31) |
1.31 (1.03, 1.66)**
|
0.83 (0.72, 0.96)**
|
1.90 (1.62, 2.23)***
|
|
Education level |
|
|
|
|
|
Not educated |
1.00 (reference) |
1.00 (reference) |
1.00 (reference) |
1.00 (reference) |
|
Up to primary |
1.03 (0.97, 1.11) |
1.20 (1.10, 1.30)***
|
0.89 (0.84, 0.94)***
|
1.15 (1.09, 1.22)***
|
|
Up to secondary |
0.87 (0.83, 0.93)***
|
1.23 (1.15, 1.32)***
|
0.86 (0.82, 0.90)***
|
1.19 (1.13, 1.25)***
|
|
More than secondary |
0.59 (0.54, 0.64)***
|
1.38 (1.27, 1.50)***
|
0.71 (0.66, 0.76)***
|
1.04 (0.97, 1.12) |
|
Wealth index |
|
|
|
|
|
Poorest |
1.00 (reference) |
1.00 (reference) |
1.00 (reference) |
1.00 (reference) |
|
Poorer |
0.85 (0.80, 0.89)***
|
1.61 (1.47, 1.76)***
|
0.84 (0.81, 0.89)***
|
1.75 (1.62, 1.90)***
|
|
Middle |
0.68 (0.65, 0.72)***
|
2.49 (2.27, 2.72)***
|
0.73 (0.69, 0.76)***
|
2.76 (2.55, 2.99)***
|
|
Richer |
0.59 (0.56, 0.64)***
|
3.69 (3.37, 4.04)***
|
0.60 (0.57, 0.64)***
|
4.33 (3.99, 4.71)***
|
|
Richest |
0.43 (0.40, 0.47)***
|
5.10 (4.63, 5.62)***
|
0.47 (0.44, 0.51)***
|
5.63 (5.15, 6.15)***
|
|
Tobacco |
|
|
|
|
|
No tobacco |
1.00 (reference) |
1.00 (reference) |
1.00 (reference) |
1.00 (reference) |
|
Only smoking tobacco |
1.09 (1.03, 1.15)***
|
0.78 (0.74, 0.83)***
|
1.49 (1.25, 1.77)***
|
1.02 (0.83, 1.25) |
|
Only smokeless tobacco |
1.05 (1.00, 1.10)**
|
0.85 (0.81, 0.89)***
|
1.37 (1.30, 1.45)***
|
0.88 (0.83, 0.95)***
|
|
Both smoking and smokeless tobacco |
1.04 (0.98, 1.11) |
0.73 (0.68, 0.78)***
|
1.06 (0.77, 1.45) |
0.80 (0.61, 1.05) |
Table 4.Adjusted relative risk ratio of underweight and overweight/obesity by food consumption patterns as determined through multinomial logistic regression analysis, NFHS-4, 2015-16, India1
|
Food consumption |
Men
|
Women
|
|
Underweight |
Overweight/obesity |
Underweight |
Overweight/obesity |
|
Milk/curd |
|
|
|
|
|
Never |
1.00 (reference) |
1.00 (reference) |
1.00 (reference) |
1.00 (reference) |
|
Occasionally |
0.82 (0.76, 0.88)***
|
0.94 (0.86, 1.03) |
1.02 (0.96, 1.08) |
0.97 (0.91, 1.04) |
|
Daily |
0.75 (0.69, 0.81)***
|
0.99 (0.90, 1.08) |
0.92 (0.86, 0.98)***
|
0.94 (0.88, 1.01)*
|
|
Pulses |
|
|
|
|
|
Never |
1.00 (reference) |
1.00 (reference) |
1.00 (reference) |
1.00 (reference) |
|
Occasionally |
1.03 (0.80, 1.34) |
1.17 (0.85, 1.61) |
1.04 (0.83, 1.29) |
0.72 (0.57, 0.92)***
|
|
Daily |
1.05 (0.81, 1.36) |
1.24 (0.90, 1.71) |
1.02 (0.82, 1.27) |
0.73 (0.57, 0.94)**
|
|
Vegetables |
|
|
|
|
|
Never |
1.00 (reference) |
1.00 (reference) |
1.00 (reference) |
1.00 (reference) |
|
Occasionally |
0.90 (0.71, 1.14) |
1.08 (0.78, 1.51) |
0.76 (0.59, 0.98)**
|
0.94 (0.68, 1.30) |
|
Daily |
0.85 (0.67, 1.08) |
1.14 (0.82, 1.59) |
0.73 (0.57, 0.94)**
|
1.05 (0.76, 1.45) |
|
Fruits |
|
|
|
|
|
Never |
1.00 (reference) |
1.00 (reference) |
1.00 (reference) |
1.00 (reference) |
|
Occasionally |
1.02 (0.91, 1.14) |
1.10 (0.93, 1.29) |
0.91 (0.82, 1.00)*
|
1.01 (0.88, 1.16) |
|
Daily |
1.01 (0.89, 1.15) |
1.25 (1.05, 1.49)**
|
0.82 (0.73, 0.92)***
|
1.13 (0.98, 1.31) |
|
Eggs |
|
|
|
|
|
Never |
1.00 (reference) |
1.00 (reference) |
1.00 (reference) |
1.00 (reference) |
|
Occasionally |
0.92 (0.86, 0.98)**
|
0.93 (0.86, 1.01)*
|
0.98 (0.92, 1.04) |
0.89 (0.83, 0.96)***
|
|
Daily |
1.02 (0.91, 1.15) |
1.02 (0.91, 1.15) |
1.16 (1.03, 1.30)**
|
1.00 (0.90, 1.12) |
|
Fish |
|
|
|
|
|
Never |
1.00 (reference) |
1.00 (reference) |
1.00 (reference) |
1.00 (reference) |
|
Occasionally |
1.02 (0.96, 1.09) |
1.10 (1.02, 1.19)**
|
0.98 (0.92, 1.04) |
1.07 (0.99, 1.15)*
|
|
Daily |
0.84 (0.74, 0.96)***
|
1.04 (0.92, 1.17) |
0.78 (0.70, 0.87)***
|
1.08 (0.98, 1.20) |
|
Chicken |
|
|
|
|
|
Never |
1.00 (reference) |
1.00 (reference) |
1.00 (reference) |
1.00 (reference) |
|
Occasionally |
0.95 (0.88, 1.03) |
1.07 (0.98, 1.17) |
0.99 (0.92, 1.07) |
1.06 (0.98, 1.16) |
|
Daily |
1.09 (0.91, 1.30) |
1.09 (0.92, 1.29) |
0.99 (0.83, 1.20) |
1.07 (0.90, 1.27) |
|
Fried food |
|
|
|
|
|
Never |
1.00 (reference) |
1.00 (reference) |
1.00 (reference) |
1.00 (reference) |
|
Occasionally |
1.00 (0.93, 1.07) |
0.96 (0.89, 1.03) |
1.06 (0.98, 1.15) |
0.86 (0.79, 0.94)***
|
|
Daily |
1.01 (0.92, 1.10) |
0.93 (0.85, 1.02) |
1.03 (0.94, 1.14) |
0.89 (0.81, 0.98)**
|
|
Aerated drinks |
|
|
|
|
|
Never |
1.00 (reference) |
1.00 (reference) |
1.00 (reference) |
1.00 (reference) |
|
Occasionally |
0.98 (0.93, 1.04) |
1.15 (1.08, 1.22)***
|
0.90 (0.86, 0.94)***
|
1.11 (1.06, 1.17)***
|
|
Daily |
0.89 (0.81, 0.98)**
|
1.18 (1.08, 1.30)***
|
0.91 (0.83, 1.00)**
|
1.07 (0.98, 1.18) |
REFERENCES
- 1. Agrawal P, Gupta K, Mishra V, Agrawal S. Effects of sedentary lifestyle and dietary habits on body mass index change among adult women in India: findings from a follow-up study. Ecol Food Nutr 2013;52:387-406.ArticlePubMedPMC
- 2. GBD 2015 Obesity Collaborators, Afshin A, Forouzanfar MH, Reitsma MB, Sur P, Estep K, et al. Health effects of overweight and obesity in 195 countries over 25 years. N Engl J Med 2017;377:13-27.ArticlePubMedPMC
- 3. World Health Organization. Diet, nutrition and the prevention of chronic diseases: report of a joint WHO/FAO expert consultation; 2003 [cited 2019 Aug 1]. Available from: https://apps.who.int/iris/bitstream/handle/10665/42665/WHO_TRS_916.pdf?sequence=1.
- 4. NCD Risk Factor Collaboration (NCD-RisC). Trends in adult body-mass index in 200 countries from 1975 to 2014: a pooled analysis of 1698 population-based measurement studies with 19·2 million participants. Lancet 2016;387:1377-1396.ArticlePubMedPMC
- 5. Razak F, Corsi DJ, Slutsky AS, Kurpad A, Berkman L, Laupacis A, et al. Prevalence of body mass index lower than 16 among women in low-and middle-income countries. JAMA 2015;314:2164-2171.ArticlePubMed
- 6. Hasan M, Sutradhar I, Shahabuddin A, Sarker M. Double burden of malnutrition among Bangladeshi women: a literature review. Cureus 2017;9:e1986.ArticlePubMedPMC
- 7. Rawal LB, Kanda K, Mahumud RA, Joshi D, Mehata S, Shrestha N, et al. Prevalence of underweight, overweight and obesity and their associated risk factors in Nepalese adults: data from a Nationwide Survey, 2016. PLoS One 2018;13:e0205912.ArticlePubMedPMC
- 8. Prospective Studies Collaboration, Whitlock G, Lewington S, Sherliker P, Clarke R, Emberson J, et al. Body-mass index and cause-specific mortality in 900 000 adults: collaborative analyses of 57 prospective studies. Lancet 2009;373:1083-1096.ArticlePubMedPMC
- 9. Hossain P, Kawar B, El Nahas M. Obesity and diabetes in the developing world--a growing challenge. N Engl J Med 2007;356:213-215.ArticlePubMed
- 10. India State-Level Disease Burden Initiative CVD Collaborator. The changing patterns of cardiovascular diseases and their risk factors in the states of India: the Global Burden of Disease Study 1990-2016. Lancet Glob Health 2018;6:e1339-e1351.PubMedPMC
- 11. Agborsangaya CB, Ngwakongnwi E, Lahtinen M, Cooke T, Johnson JA. Multimorbidity prevalence in the general population: the role of obesity in chronic disease clustering. BMC Public Health 2013;13:1161.ArticlePubMedPMCPDF
- 12. Arokiasamy P, Uttamacharya U, Jain K, Biritwum RB, Yawson AE, Wu F, et al. The impact of multimorbidity on adult physical and mental health in low- and middle-income countries: what does the study on global ageing and adult health (SAGE) reveal? BMC Med 2015;13:178.ArticlePubMedPMCPDF
- 13. Ferraro KF, Su YP, Gretebeck RJ, Black DR, Badylak SF. Body mass index and disability in adulthood: a 20-year panel study. Am J Public Health 2002;92:834-840.ArticlePubMedPMC
- 14. Pednekar MS, Hakama M, Hebert JR, Gupta PC. Association of body mass index with all-cause and cause-specific mortality: findings from a prospective cohort study in Mumbai (Bombay), India. Int J Epidemiol 2008;37:524-535.ArticlePubMedPDF
- 15. Selvamani Y, Singh P. Socioeconomic patterns of underweight and its association with self-rated health, cognition and quality of life among older adults in India. PLoS One 2018;13:e0193979.ArticlePubMedPMC
- 16. Bhan N, Millett C, Subramanian SV, Dias A, Alam D, Williams J, et al. Socioeconomic patterning of chronic conditions and behavioral risk factors in rural South Asia: a multi-site cross-sectional study. Int J Public Health 2017;62:1019-1028.ArticlePubMedPDF
- 17. Gouda J, Prusty RK. Overweight and obesity among women by economic stratum in urban India. J Health Popul Nutr 2014;32:79-88.PubMedPMC
- 18. Rai RK, Jaacks LM, Bromage S, Barik A, Fawzi WW, Chowdhury A. Prospective cohort study of overweight and obesity among rural Indian adults: sociodemographic predictors of prevalence, incidence and remission. BMJ Open 2018;8:e021363.ArticlePubMedPMC
- 19. Chhabra P, Chhabra SK. Distribution and determinants of body mass index of non-smoking adults in Delhi, India. J Health Popul Nutr 2007;25:294-301.PubMedPMC
- 20. Subramanian SV, Perkins JM, Khan KT. Do burdens of underweight and overweight coexist among lower socioeconomic groups in India? Am J Clin Nutr 2009;90:369-376.ArticlePubMedPMCPDF
- 21. Anjana RM, Pradeepa R, Das AK, Deepa M, Bhansali A, Joshi SR, et al. Physical activity and inactivity patterns in India - results from the ICMR-INDIAB study (Phase-1) [ICMR-INDIAB-5]. Int J Behav Nutr Phys Act 2014;11:26.ArticlePubMedPMC
- 22. Pednekar MS, Gupta PC, Shukla HC, Hebert JR. Association between tobacco use and body mass index in urban Indian population: implications for public health in India. BMC Public Health 2006;6:70.ArticlePubMedPMCPDF
- 23. Shukla HC, Gupta PC, Mehta HC, Hebert JR. Descriptive epidemiology of body mass index of an urban adult population in western India. J Epidemiol Community Health 2002;56:876-880.ArticlePubMedPMC
- 24. Chockalingham R, Raghavan R, Argrawal J, Lama G, Lai HY, Yadama G. Understanding geographic variations in BMI in India; 2011 [cited 2019 Aug 1]. Available from: https://openscholarship.wustl.edu/cgi/viewcontent.cgi?article=1841&context=csd_research.
- 25. Sengupta A, Angeli F, Syamala TS, Dagnelie PC, van Schayck CP. Overweight and obesity prevalence among Indian women by place of residence and socio-economic status: contrasting patterns from ‘underweight states’ and ‘overweight states’ of India. Soc Sci Med 2015;138:161-169.ArticlePubMed
- 26. India State-Level Disease Burden Initiative Collaborators. Nations within a nation: variations in epidemiological transition across the states of India, 1990-2016 in the Global Burden of Disease Study. Lancet 2017;390:2437-2460.PubMedPMC
- 27. James KS. India’s demographic change: opportunities and challenges. Science 2011;333:576-580.ArticlePubMed
- 28. International Institute for Population Sciences. National Family Health Survey (NFHS-3), 2005–06; 2007 [cited 2019 Aug 1]. Available from: https://dhsprogram.com/pubs/pdf/frind3/frind3-vol1andvol2.pdf.
- 29. Dallongeville J, Marécaux N, Fruchart JC, Amouyel P. Cigarette smoking is associated with unhealthy patterns of nutrient intake: a meta-analysis. J Nutr 1998;128:1450-1457.ArticlePubMedPDF
- 30. Jo YH, Talmage DA, Role LW. Nicotinic receptor-mediated effects on appetite and food intake. J Neurobiol 2002;53:618-632.ArticlePubMedPMC
- 31. Mineur YS, Abizaid A, Rao Y, Salas R, DiLeone RJ, Gündisch D, et al. Nicotine decreases food intake through activation of POMC neurons. Science 2011;332:1330-1332.ArticlePubMedPMC
- 32. Basu S, McKee M, Galea G, Stuckler D. Relationship of soft drink consumption to global overweight, obesity, and diabetes: a cross-national analysis of 75 countries. Am J Public Health 2013;103:2071-2077.ArticlePubMedPMC
Citations
Citations to this article as recorded by

- Variations in adult BMI among Indian men: a quantile regression analysis
Archana Agnihotri, Brinda Viswanathan
Journal of Biosocial Science.2024; 56(2): 251. CrossRef - Characteristics of individuals at risk of malnutrition in Thailand: an investigation focusing on income insecurity
Watchara Pechdin, Pongsun Bunditsakulchai
Frontiers in Sustainable Food Systems.2024;[Epub] CrossRef - A review on usefulness of millets in current prospects
Shivam Dubey
IP Journal of Nutrition, Metabolism and Health Science.2024; 6(4): 157. CrossRef - Millet production, challenges, and opportunities in the Asia-pacific region: a comprehensive review
M. S. Harish, Axay Bhuker, Bhagirath Singh Chauhan
Frontiers in Sustainable Food Systems.2024;[Epub] CrossRef - Decomposing the gap in undernutrition among under-five children between EAG and non-EAG states of India
Sourav Chowdhury, Nuruzzaman Kasemi, Aditya Singh, Mahashweta Chakrabarty, Shivani Singh
Children and Youth Services Review.2023; 145: 106796. CrossRef - Randomized Controlled Trial Comparing Ferrous Sulfate and Iron Sucrose in Iron Deficiency Anemia in Pregnancy
Neha Chauhan, Poojan Dogra, Reena Sharma, Shashi Kant, Mridul Soni
Cureus.2023;[Epub] CrossRef - Maternal nutritional status and milk volume and composition in India: an observational study
Melissa F. Young, Emily C. Faerber, Rukshan V. Mehta, Samriddhi Ranjan, Sweekruthi A. Shetty, Usha Ramakrishnan, Kannan Rangiah, Beena Bose, Sarita Devi, Pratibha Dwarkanath, Anura V. Kurpad, Sunita Taneja, Reynaldo Martorell
The American Journal of Clinical Nutrition.2023; 117(4): 830. CrossRef - Yield improvement compensates the grain nutrient concentration in finger millet (Eleusine coracana L.): analysis using varieties released over years
K. C. Megha, Y. A. Nanja Reddy, D. C. Hanumanthappa
Plant Physiology Reports.2023; 28(2): 199. CrossRef - Burden of tuberculosis & malaria among tribal populations & implications for disease elimination in India
Jai Prakash Narain, Amar N. Shah, Rajesh Bhatia
Indian Journal of Medical Research.2023; 157(2&3): 163. CrossRef - Assessment of thinness based on BMI and MUAC among the adult Jaunsari
Koel Mukherjee, Pulamaghatta N. Venugopal, Kaustav Das
Human Biology and Public Health.2023;[Epub] CrossRef - Concurrent Undernutrition and Overnutrition within Indian Families between 2006 and 2021
Laxmi Kant Dwivedi, Parul Puri, Anjali Pant, Alka Chauhan, Samuel Scott, Shrikant Singh, Sarang Pedgaonker, Phuong H. Nguyen
Current Developments in Nutrition.2023; 7(9): 101987. CrossRef - Rural-urban disparities in nutritional status among women in Ethiopia based on HIV serostatus: a cross-sectional study using demographic and health survey data
Hirut Abebe, Anette Agardh, Malachi Ochieng Arunda
BMC Infectious Diseases.2023;[Epub] CrossRef - Evaluation of a results-based financing nutrition intervention for tuberculosis patients in Madhya Pradesh, India, implemented during the COVID-19 pandemic
Embry Howell, Rama Rao Dammala, Pratibha Pandey, Darcy Strouse, Atul Sharma, Neeta Rao, Sudheer Nadipally, Amar Shah, Varsha Rai, Russell Dowling
BMC Global and Public Health.2023;[Epub] CrossRef - Not Hungry, but Still Snacking: The Association Between Hedonic Hunger and Snacking Behaviour Among Young Adults in Vadodara, Gujarat
Margi Mankad, Devaki Gokhale
Cureus.2023;[Epub] CrossRef - Inequalities in the prevalence of double burden of malnutrition among mother–child dyads in India
Saurabh Singh, Neha Shri, Akancha Singh
Scientific Reports.2023;[Epub] CrossRef - Imperatives of recognising the complexities: gendered impacts and responses to COVID-19 in India
Bina Agarwal
Economia Politica.2022; 39(1): 31. CrossRef - Household Levels of Double Burden of Malnutrition in Low–Middle-income Countries: A Review
A. Bose, N. Mondal, J. Sen
Journal of the Anthropological Survey of India.2022; 71(1): 125. CrossRef - Mustard oil and cardiovascular health: Why the controversy?
Kavita H. Poddar, Geeta Sikand, Dinesh Kalra, Nathan Wong, P. Barton Duell
Journal of Clinical Lipidology.2022; 16(1): 13. CrossRef - Nutritional Supplementation Would Be Cost-Effective for Reducing Tuberculosis Incidence and Mortality in India: The Ration Optimization to Impede Tuberculosis (ROTI-TB) Model
Pranay Sinha, Subitha L Lakshminarayanan, Chelsie Cintron, Prakash Babu Narasimhan, Lindsey M Locks, Nalin Kulatilaka, Kimberly Maloomian, Senbagavalli Prakash Babu, Madeline E Carwile, Anne F Liu, C Robert Horsburgh, Carlos Acuna-Villaorduna, Benjamin P
Clinical Infectious Diseases.2022; 75(4): 577. CrossRef - Modern Processing of Indian Millets: A Perspective on Changes in Nutritional Properties
N. A. Nanje Gowda, Kaliramesh Siliveru, P. V. Vara Prasad, Yogita Bhatt, B. P. Netravati, Chennappa Gurikar
Foods.2022; 11(4): 499. CrossRef - Untangling the Web of Malnutrition, Sarcopenia, and Frailty in Chronic Liver Disease
Vivek A. Saraswat, Karan Kumar
Journal of Clinical and Experimental Hepatology.2022; 12(2): 268. CrossRef - Does maternal overnutrition carry child undernutrition in India?
Mukesh Kumar, Pratap Mohanty, Linglin Xie
PLOS ONE.2022; 17(6): e0265788. CrossRef - Double burden of malnutrition in Nepal: A trend analysis of protein-energy malnutrition and High Body Mass Index using the data from Global Burden of Disease 2010–2019
Priza Pradhananga, Archana Shrestha, Nabin Adhikari, Namuna Shrestha, Mukesh Adhikari, Nicole Ide, Saurya Dhungel, Swornim Bajracharya, Anu Aryal, Pranil Man Singh Pradhan
PLOS ONE.2022; 17(9): e0273485. CrossRef - Nutrition in the prevention and management of sarcopenia - A special focus on Asian Indians
Shinjini Bhattacharya, Rohini Bhadra, Annemie M.W.J. Schols, Ardy van Helvoort, Sucharita Sambashivaiah
Osteoporosis and Sarcopenia.2022; 8(4): 135. CrossRef - Chronic Energy Deficiency and Its Determinant Factors among Adults Aged 18–59 Years in Ethiopia: A Cross-Sectional Study
Samuel Dagne, Yonatan Menber, Yosef Wassihun, Gedefaw Dires, Atitegeb Abera, Seteamlak Adane, Melese Linger, Zelalem T. Haile, Roxana Valdés-Ramos
Journal of Nutrition and Metabolism.2021; 2021: 1. CrossRef - The double burden of malnutrition in India: Trends and inequalities (2006–2016)
Phuong Hong Nguyen, Samuel Scott, Derek Headey, Nishmeet Singh, Lan Mai Tran, Purnima Menon, Marie T. Ruel, Srinivas Goli
PLOS ONE.2021; 16(2): e0247856. CrossRef - Double burden of underweight and overweight among Indian adults: spatial patterns and social determinants
Pravat Bhandari, Ezra Gayawan, Suryakant Yadav
Public Health Nutrition.2021; 24(10): 2808. CrossRef - Screening of cardiovascular risk assessment accuracy of anthropometric indices in Indian children and adolescents
Mohit Aggarwal, Shailendra Singh, Anubhuti Bansal, Bapu Koundinya Desiraju, Anurag Agrawal
Wellcome Open Research.2021; 5: 273. CrossRef - Assessment of Sarcopenia in Chronic Liver Disease: Indian Perspective
Abhinav Anand, Anoop Saraya
Clinical Liver Disease.2021; 18(3): 164. CrossRef - ‘Bhavishya Shakti: Empowering the Future’: establishing and evaluating a pilot community mobile teaching kitchen as an innovative model, training marginalised women to become nutrition champions and culinary health educators in Kolkata, India
Luke Buckner, Harrison Carter, Dominic Crocombe, Sento Kargbo, Maria Korre, Somnath Bhar, Shivani Bhat, Debashis Chakraborty, Pauline Douglas, Mitali Gupta, Sudeshna Maitra-Nag, Sagarika Muhkerjee, Aparjita Saha, Minha Rajput-Ray, Ianthi Tsimpli, Sumantra
BMJ Nutrition, Prevention & Health.2021; 4(2): 405. CrossRef - Prevalence and determinants of double burden of malnutrition in Bangladesh: evidence from a nationwide cross-sectional survey
Md. Ashfikur Rahman, Henry Ratul Halder, Tanjim Siddiquee, Syeda Afia Farjana, Harun Or Roshid, Bayezid Khan, Nuzhat Fatema, Md. Hasan Howlader, Shaharior Rahman Razu
Nutrire.2021;[Epub] CrossRef - Tuberculosis—Learning the Impact of Nutrition (TB LION): protocol for an interventional study to decrease TB risk in household contacts
Chelsie Cintron, Prakash Babu Narasimhan, Lindsey Locks, Senbagavalli Babu, Pranay Sinha, Nonika Rajkumari, Vaishnavi Kaipilyawar, Anurag Bhargava, Kimberly Maloomian, Padma Chandrasekaran, Sheetal Verma, Noyal Joseph, W. Evan Johnson, Christine Wanke, C.
BMC Infectious Diseases.2021;[Epub] CrossRef - An Epidemiological Study for Assessment of Selected Lifestyle Disorders among University Students at Central Gujarat, India
Geetika Madan Patel, Dhara I Zalavadiya, Ankita Parmar
Healthline.2021; 12(2): 21. CrossRef - The dramatic rise in the prevalence of overweight and obesity in India: Obesity transition and the looming health care crisis
Zakaria Siddiqui, Ronald Donato
World Development.2020; 134: 105050. CrossRef - Factors associated with double burden of malnutrition among mother-child pairs in India: A study based on National Family Health Survey 2015–16
Ratna Patel, Shobhit Srivastava, Pradeep Kumar, Shekhar Chauhan
Children and Youth Services Review.2020; 116: 105256. CrossRef - Intra-Individual Double Burden of Malnutrition among Adults in China: Evidence from the China Health and Nutrition Survey 2015
Qiumin Huang, Liusen Wang, Hongru Jiang, Huijun Wang, Bing Zhang, Jiguo Zhang, Xiaofang Jia, Zhihong Wang
Nutrients.2020; 12(9): 2811. CrossRef - Screening of cardiovascular risk assessment accuracy of anthropometric indices in Indian children and adolescents
Mohit Aggarwal, Shailendra Singh, Anubhuti Bansal, Bapu Koundinya Desiraju, Anurag Agrawal
Wellcome Open Research.2020; 5: 273. CrossRef

 , Y Selvamani2
 PubReader
 ePub Link
 Cite
Cite