Articles
- Page Path
- HOME > Epidemiol Health > Volume 43; 2021 > Article
-
COVID-19
Original Article
The anatomy of COVID-19 comorbidity networks among hospitalized Korean patients -
Eun Kyong Shin1*
 , Hyo Young Choi2*, Neil Hayes3
 -
Epidemiol Health 2021;43:e2021035.
DOI: https://doi.org/10.4178/epih.e2021035
Published online: May 7, 2021
1Department of Sociology, Korea University, Seoul, Korea
2Department of Preventive Medicine, University of Tennessee Health Science Center, Memphis, TN, USA
3Department of Medicine, Division of Hematology and Oncology, University of Tennessee Health Science Center, Memphis, TN, USA
- Correspondence: Eun Kyong Shin Department of Sociology, Korea University, 145 Anam-ro, Seongbuk-gu, Seoul 02841, Korea E-mail: eunshin@korea.ac.kr
- *Shin & Choi contributed equally to this work as joint first authors.
©2021, Korean Society of Epidemiology
This is an open-access article distributed under the terms of the Creative Commons Attribution License (http://creativecommons.org/licenses/by/4.0/), which permits unrestricted use, distribution, and reproduction in any medium, provided the original work is properly cited.
Abstract
-
OBJECTIVES
- We aimed to examine how comorbidities were associated with outcomes (illness severity or death) among hospitalized patients with coronavirus disease 2019 (COVID-19).
-
METHODS
- Data were provided by the National Medical Center of the Korea Disease Control and Prevention Agency. These data included the clinical and epidemiological information of all patients hospitalized with COVID-19 who were discharged on or before April 30, 2020 in Korea. We conducted comorbidity network and multinomial logistic regression analyses to identify risk factors associated with COVID-19 disease severity and mortality. The outcome variable was the clinical severity score (CSS), categorized as mild (oxygen treatment not needed), severe (oxygen treatment needed), or death.
-
RESULTS
- In total, 5,771 patients were included. In the fully adjusted model, chronic kidney disease (CKD) (odds ratio [OR], 2.58; 95% confidence interval [CI], 1.19 to 5.61) and chronic obstructive pulmonary disease (COPD) (OR, 3.19; 95% CI, 1.35 to 7.52) were significantly associated with disease severity. CKD (OR, 5.35; 95% CI, 2.00 to 14.31), heart failure (HF) (OR, 3.15; 95% CI, 1.22 to 8.15), malignancy (OR, 3.38; 95% CI, 1.59 to 7.17), dementia (OR, 2.62; 95% CI, 1.45 to 4.72), and diabetes mellitus (OR, 2.26; 95% CI, 1.46 to 3.49) were associated with an increased risk of death. Asthma and hypertension showed statistically insignificant associations with an increased risk of death.
-
CONCLUSIONS
- Underlying diseases contribute differently to the severity of COVID-19. To efficiently allocate limited medical resources, underlying comorbidities should be closely monitored, particularly CKD, COPD, and HF.
- With the growing spread of coronavirus disease 2019 (COVID-19), the complex and varying fatality rates call for a new perspective on pandemics [1-3]. The alarming rate of growth of the COVID-19 pandemic has highlighted a lack of understanding of factors that influence disease severity and mortality. The global diffusion paths and regionally distinctive transmission patterns highlight the complex nature of this 21st-century epidemic [4]. Severe acute respiratory syndrome coronavirus 2 (SARS-CoV-2), the virus that causes COVID-19, is not only novel but also displays large variations in mortality rates across regions [2,5-8]. Case fatality varies greatly both within and among countries. This heterogeneity in the fatality rate may be explained by differences in population demographics [9,10], access to adequate medical care [10,11], and the presence of comorbidities. The prevalence of comorbidities in COVID-19 cases varies widely across countries and populations [7,12-15]. In-depth understanding of the importance of underlying disease is urgently needed to efficiently identify the patients at highest risk and thus improve medical resource allocation and distribution.
- In particular, understanding networks of underlying diseases can help identify at-risk populations. Rather than focusing on the prevalence of a comorbidity in a single segment of the population, comorbidity networks can be used to depict relative centralities and efficiently pinpoint the risk [16,17]. Past studies have shown that comorbidities are significantly associated with clinical outcomes of COVID-19 [5,7,18-22]. The most common comorbidities among confirmed patients are diabetes mellitus (DM) [23,24] and hypertension (HTN) [25], while chronic obstructive pulmonary disease (COPD) and cancer are also associated with higher mortality and poor outcomes [19]. Cancer patients are also thought to be particularly vulnerable to infection [26]. The high prevalence of HTN among patients with COVID-19 is not surprising; HTN is common in older people, who appear to have an elevated risk of experiencing severe disease and its complications [27-29]. However, the relevance of pre-existing comorbidities to fatality risk requires further understanding. We investigated the comorbidities and symptom networks of hospitalized COVID-19 patients and the associations with clinical severity and mortality from COVID-19.
INTRODUCTION
- Data source
- The Korea Disease Control and Prevention Agency provided the data for this study. These data included basic information, laboratory results at the time of initial examination, the hospitalization history, hospital conditions, clinical severity, general blood test results, and history of chronic disease.
- Study patients and covariates
- We included all patients who were confirmed to have COVID-19, hospitalized, and discharged in Korea between January 21, 2020 and April 30, 2020, excluding 14 cases involving pregnancy, 27 cases with no clinical severity reported, and 4 cases with incomplete data. The final sample included 5,571 patients.
- Exposure of interest
- This study was focused on the presence of comorbidities. We included the following common comorbid conditions reported by patients at the time of hospitalization: DM, HTN, heart failure (HF), cardiac conduction disease (CCD), asthma, COPD, chronic kidney disease (CKD), malignancy, chronic liver disease (CLD), rheumatic disease/autoimmune disorder (RDAD), and dementia. These underlying diseases are the most commonly observed comorbidities among COVID-19 patients [19,22].
- Outcomes
- The outcome variable was the clinical severity score (CSS). The CSS was initially classified into 8 categories: 1 (no activity limitation), 2 (limited activity but no oxygen [O2] required), 3 (O2 with nasal prongs), 4 (O2 with facial mask), 5 (non-invasive ventilation), 6 (invasive ventilation), 7 (multiorgan failure/extracorporeal membrane oxygenation), and 8 (death). Few cases (n = 106, 1.9%) were categorized between 4 and 7 (4, n= 43; 5, n= 33; 6, n= 19; 7, n= 11), making statistical analyses using all the 8 levels of the variable invalid. To increase the statistical power with a balanced sample distribution, we converted this raw scale into new CSS categories. Risk factor analyses commonly involve dichotomous variables such as alive/dead or non-severe/severe. However, this could result in a loss of information regarding the original variable. To accurately examine the impacts of comorbidities on severity, we converted the raw scale into 3 new categories: 1, mild disease (O2 treatment not needed, original scale= 1-2); 2, severe disease (O2 treatment needed, original scale= 3-7); and 3, death (raw scale= 8).
- Statistical analysis
- First, patients’ demographic characteristics were summarized in relation to the means and interquartile ranges of the CSS groups. We performed statistical tests to identify any significant inter-group differences with respect to symptoms and comorbidities.
- Second, the relationships between COVID-19 severity and comorbidities were examined using 2-mode network analysis. Comorbidity prevalence was also summarized via a similar network analysis [30,31]. A single comorbidity was expected to yield a different CSS from 2 or more concurrent comorbidities. In the network, nodes represent other diseases present among the COVID-19 patients. Lines (links) indicate the coappearance of 2 or more underlying diseases in a patient. A comorbidity network, which is essentially a constellation of diseases, can effectively indicate the relative prevalence rates of underlying diseases [17]. The comorbidity networks for severe disease and death were compared with those for mild disease. Since the COVID-19 disease course unfolds differently according to the pathological history of each individual, simply understanding the virus is not enough to understand individual variation in response to the virus. Applying a network perspective helps elucidate the complex pathodynamics of COVID-19. A symptom or chronic disease network should assist healthcare workers in more easily identifying groups at highrisk for poor outcomes of COVID-19. We compared the relative connectivity of each node with other underlying diseases using eigenvector and weighted degree centralities. Eigenvector centrality is a measure of the influence of a node in a network. Relative centrality scores are assigned to each node based on its connectivity to other nodes. Weighted degree centrality refers to the sum of the weights assigned to capture the strengths of the links to other directly connected diseases. While eigenvector centrality can be used to identify how diseases are commonly connected to all other diseases, weighted degree centrality can capture the strength of these connections. We used both measures to depict the COVID-19 comorbidity network structure.
- Next, we used the correlation structure between each pair of comorbidity and symptom variables to identify any associations. A p-value was derived for each of the estimated correlation coefficients based on the Pearson correlation test [32]. The statistical significance of the association was described using edge bundling for graph visualization. This analysis was used to investigate the association between each underlying disease and the risk of developing COVID-19 symptoms.
- Finally, we conducted multinomial logistic regression analysis [33-35] to identify risk factors associated with illness severity and mortality among COVID-19 patients by comparing the severe illness and death CSS groups with the mild group. This enabled an in-depth examination that may have been obscured if we had used only 2 categories, such as survival and death. After all, some comorbidities may be associated with severe disease but not lead to death, or vice versa. Our outcomes of interest were the risk factors statistically associated with the presence of severe shortness of breath (SOB); therefore, ventilation treatment was included as a risk factor, as were the risk factors associated with death. Two levels of model adjustment were used: age, sex, and body mass index (BMI) (the most common control variables in the existing comorbidity studies [7,22,36]) only (model 1) and additional adjustment of model 1 for all of the comorbidity covariates (model 2). All statistical analyses were performed using R version 4.0.0 (R Foundation for Statistical Computing, Vienna, Austria), and graphical visualization was performed with Gephi software. The multinomial function from the nnet package was used to construct multinomial logistic regression models. We considered a pvalue < 0.05 to indicate statistical significance.
- Ethics statement
- This study was approved by the Korea University Institutional Review Board (IRB-2020-0177).
MATERIALS AND METHODS
- A total of 5,571 patients were included in this study (Tables 1 and 2), of whom 3,267 (58.6%) were female and 2,304 (41.4%) were male. A total of 1,770 patients (31.8%) were over 60 years old. HTN was the most common comorbid condition (21.5%), followed by DM (12.3%), dementia (4.0%), and CCD (3.2%). Other comorbidities included malignancy (2.6%), asthma (2.3%), CLD (1.5%), HF (1.0%), CKD (1.0%), COPD (0.7%), and RDAD (0.7%). Cough (41.7%) was the most common symptom, followed by sputum production (28.8%), fever (23.3%), and headache (17.3%). Other symptoms included muscle aches (16.4%), sore throat (15.6%), SOB (11.9%), rhinorrhea (11.0%), diarrhea (9.2%), vomiting and nausea (VN; 4.4%), fatigue (4.2%), and alteration of consciousness (ACC; 0.6%).
- We converted the raw COVID-19 severity scale (CSS) scores into 3 new categories: 1, mild disease (O2 treatment not needed, original scale= 1-2); 2, severe disease (O2 treatment needed, original scale= 3-7); and 3, death (raw scale= 8). Based on this new scale, 4,762 patients (85.5%) did not require O2 treatment (CSS= 1), 575 patients (10.3%) required O2 treatment (CSS = 2), and 234 patients (4.2%) died (CSS= 3). Using the unadjusted multinomial logistic models, age, sex, BMI, every symptom, and every comorbidity except CLD were found to be associated with CSS. Consistent with previous studies, older patients and male patients had significantly higher CSS scores than younger and female patients, respectively. COVID-19 patients with pre-existing DM, HTN, HF, asthma, COPD, CKD, RDAD, or dementia were more likely to be in a critical condition requiring ventilation and had higher mortality. Patients with CCD did not have a significantly increased risk of SOB, but did have higher mortality. In contrast, patients with malignancy were more likely to experience increased SOB, but they were not more likely to die.
- Comorbidities and COVID-19 symptoms
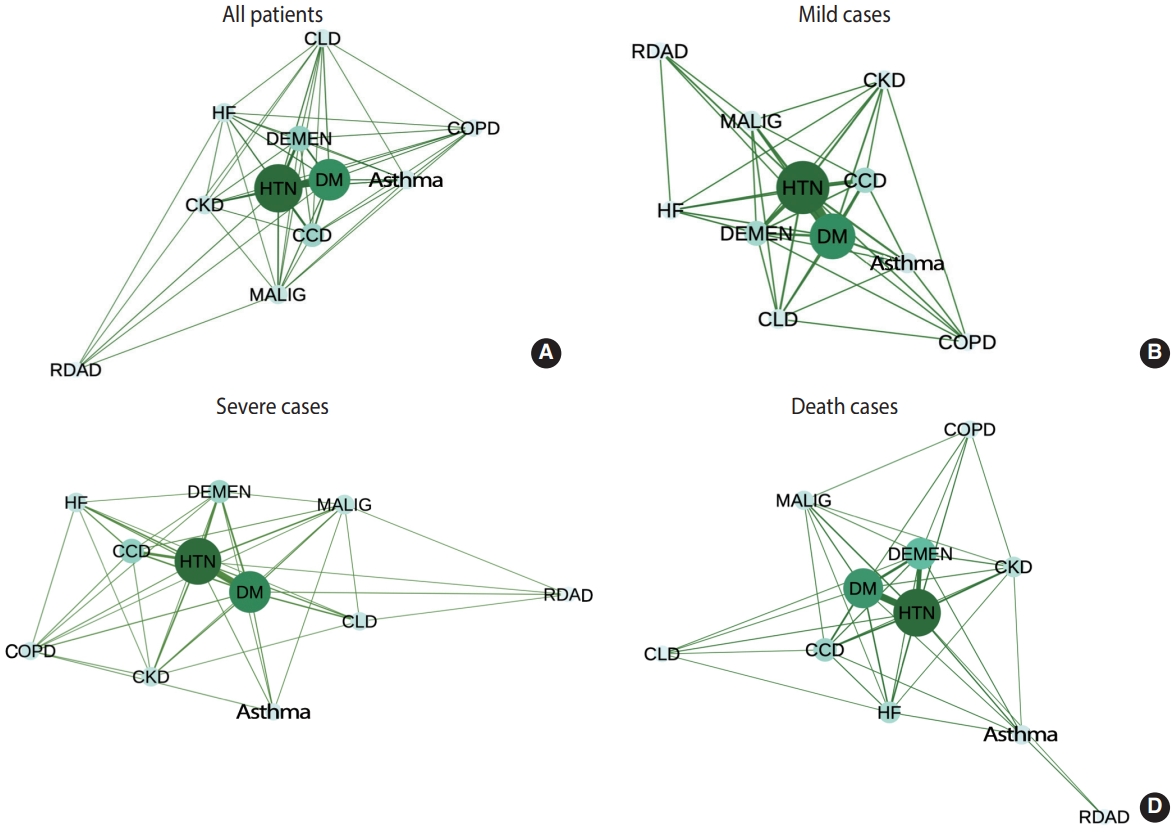
- Figure 1 presents the comorbidity networks for the hospitalized COVID-19 patients. HTN and DM were the most common underlying diseases. The overall comorbidity network is shown in Figure 1A. These comorbidities were not only most common among COVID-19 patients, but they also often appeared concomitantly with other chronic diseases. The comorbidity networks for mild disease (n= 4,762), severe disease (n= 575), and death (n= 234) are shown in Figure 1B-1D. As severity increased, centralities of disease severity emerged more prominently as key nodes in the network. The main components of the severe and fatal networks were HTN, DM, CCD, and dementia. Thus, the severe and fatal cases had distinct underlying comorbidity patterns compared to the mild cases. The eigenvector centrality and weighted degree centrality of each comorbidity are summarized in Table 3. Very little variation in degree centrality was present among the 11 underlying diseases because they were commonly co-observed among the confirmed COVID-19 patients. The clinical importance of a disease is indicated by a significant difference in its centrality across severity groups. Although high prevalence alone does not mean that a disease is a critical contributor to increased disease severity, its relative connectivity to other underlying diseases is an important factor for identifying patients at greater risk. For example, although HTN was the most common disease present among the hospitalized COVID-19 patients, the relative centrality of HTN was particularly highly pronounced among the fatal cases. HF was also found to be one of the most prevalent comorbidities, yet its relative centrality among patients with mild and severe cases was low. DM was the most central underlying disease among the mild and severe cases.
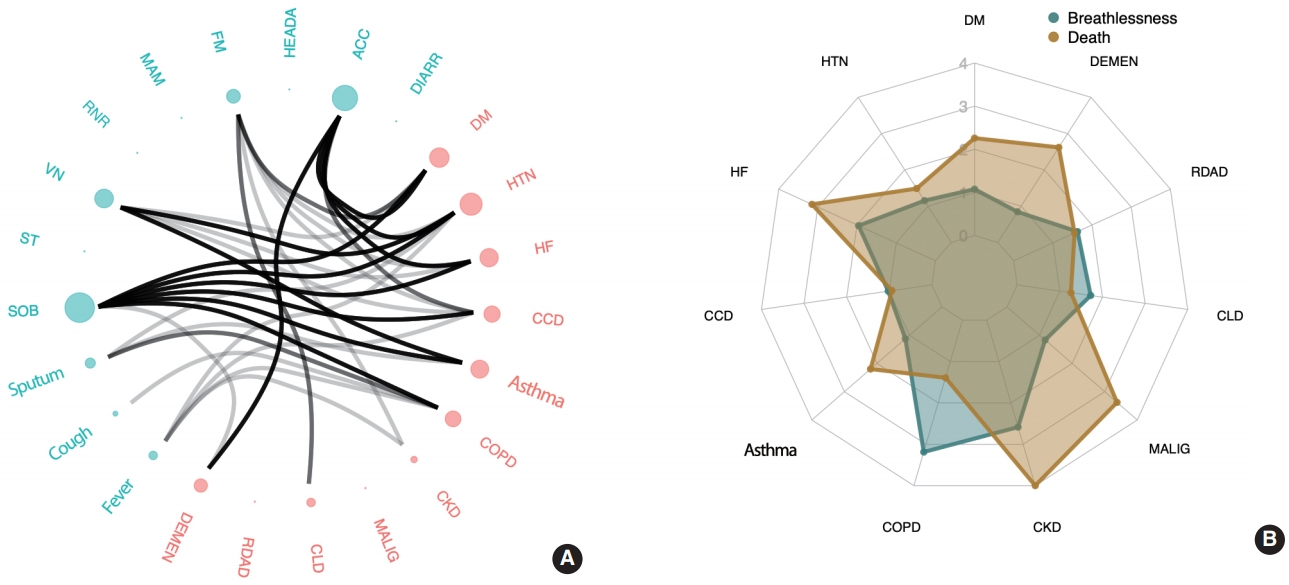
- Figure 2A shows the associations between comorbidities and COVID-19 symptoms. The comorbidity most commonly and strongly associated with multiple symptoms was HTN, followed by DM, HF, asthma, and CCD. Among the reported symptoms, SOB consistently showed a strong correlation with comorbidities, including DM, HTN, HF, CCD, asthma, and COPD. Although SOB was exhibited in only 11.9% of the reported cases in our study (a relatively small proportion compared to cough, fever, and sputum), it is noteworthy that it was the most prevalent symptom strongly associated with comorbidities.
- Regarding the impact of comorbidities on symptoms, COVID-19 patients with HTN were at a greater risk of having 1 or more of these symptoms: ACC, VN, SOB, fatigue, sputum production, and fever, listed in the order of the strongest to the weakest association (p < 0.05). Patients with DM were more likely to have ACC, SOB, fatigue, and VN than patients without DM. HF was associated with ACC, SOB, and VN. Patients with asthma showed an increased risk of experiencing SOB, VN, and sputum production. Patients with CCD were more likely to experience SOB, ACC, VN, and fever. COPD was associated with a higher risk of SOB, sputum production, cough, and fever. Patients with CKD were more likely to experience fatigue and fever. CLD was only associated with fatigue, and dementia was associated with ACC and SOB.
- Multinomial logistic regression (severe disease and death)
- In model 1 (adjusted for age, sex, and BMI only), CKD and HF were significant risk factors for both severe disease and mortality. DM, HTN, malignancy, and dementia showed strong associations with increased mortality alone, whereas COPD was associated with severe disease alone.
- Model 2 included additional adjustment for all of the comorbidity covariates (Table 4 and Figure 2B). In this model, age and sex (female) were associated with both severe disease and death, as was CKD, as is consistent with the results from model 1. Patients with COPD had a greater risk of developing breathing difficulties, but no significantly higher risk of death. DM, HF, malignancy, and dementia were strongly associated with the risk of death.
- More specifically, the risk of severe disease increased with the presence of COPD (odds ratio [OR], 3.19; 95% confidence interval [CI], 1.35 to 7.52) and CKD (OR, 2.58; 95% CI, 1.19 to 5.61). HF, which was associated with severe breathing difficulties in model 1, showed a weaker association in model 2. The risk of death was most strongly associated with CKD (OR, 5.35; 95% CI, 2.00 to 14.31), followed by malignancy (OR, 3.38; 95% CI, 1.59 to 7.17), HF (OR, 3.15; 95% CI, 1.22 to 8.15), dementia (OR, 2.62; 95% CI, 1.45 to 4.72), and DM (OR, 2.26; 95% CI, 1.46 to 3.49). Other comorbidities rather weakly associated (p< 0.1) with increased mortality were asthma and HTN, although the associations were not statistically significant at a level of significance of 0.05 (asthma: OR, 2.20; 95% CI, 0.86 to 5.59; p= 0.10 and HTN: OR, 1.49; 95% CI, 0.95 to 2.31; p= 0.08).
RESULTS
- This study was a national case series focused on the complexity of comorbidities among hospitalized COVID-19 patients. Relative to the general population, the included patients were relatively likely to be older, to be female, and to have pre-existing HTN and/or DM. However, the presence of underlying disease was not always associated with increased disease severity. Although HTN was the most common comorbidity in this study, it was not a statistically significant factor in explaining severity after controlling for other comorbidities. Thus, prevalence alone does not explain symptom severity.
- While everyone may be equally susceptible to SARS-CoV-2, symptom progression after infection is not homogeneous. Identifying the comorbidities that are more likely to cause deterioration in a patient’s condition can be vital for the efficient use of healthcare resources. Most hospitalized patients in this study had at least 1 comorbidity. An increase in the presence of comorbidities may explain the wide variation in COVID-19 mortality across regions and age groups. Therefore, even among people exposed to the same virus, the clinical outcomes may vary.
- This study had several limitations. First, the data were collected from an electronic health record database, which fails to include more detailed information that may be present in manual medical records. The comorbidity variables were dummy variables in our study. Second, we studied only hospitalized patients who had been discharged, potentially excluding severely ill patients who were admitted for extended periods. The total number of confirmed COVID-19 patients in Korea by April 30, 2020 was 10,765, with 247 deaths. Therefore, our study included only 51.7% of all confirmed cases and 94.7% of all deaths. The prevalence of many comorbidities is known to increase with age. In this study, age was categorized in 10-year bands, which could be too wide of an interval to capture more subtle within-band differences. Therefore, age might not have been completely adjusted for, causing our model to overestimate the association between the presence of comorbidities and disease severity. Lastly, this study did not include information regarding residential area. Although the overall comorbidity patterns between patients from Daegu and patients from other areas have been found to be consistent [22], chronic affinity may exhibit different geo-prevalence [37]. More research with finer geo-granularity is needed to unpack the influence of residential area on the epidemic and patients’ clinical course.
- In this study, we explored the complexities of COVID-19 comorbidities to understand their contributions to disease severity. We found that the high prevalence of a comorbidity did not necessarily contribute to COVID-19 severity. However, the presence of underlying comorbidities had a varied effect on disease severity in COVID-19 patients. Insight into underlying diseases that critically contribute to COVID-19 severity is important in designing an efficient pandemic control policy. In the present study, HTN and DM appeared to be dominant underlying factors, and both are preventable chronic diseases. Healthcare systems should provide programs for the early detection and effective treatment of these conditions and maximize public educational opportunities. Routine management of chronic diseases could serve as an important social immunity mechanism, even in the unprecedented event of an infectious disease crisis.
DISCUSSION
-
CONFLICT OF INTEREST
The authors have no conflicts of interest to declare for this study.
-
FUNDING
This study was supported by a faculty research grant from the College of Liberal Arts at Korea University in 2019-2021 (K19-22681).
-
AUTHOR CONTRIBUTIONS
Conceptualization: EKS. Data curation: EKS, HYC. Formal analysis: EKS, HYC. Funding acquisition: EKS. Methodology: EKS, HYC. Project administration: EKS. Visualization: EKS, HYC. Writing – original draft: EKS, HYC. Writing – review & editing: EKS, HYC, NH.
NOTES
ACKNOWLEDGEMENTS


| Characteristics | n (%) | CSS, mean [Q1, Q3] | p-value |
|---|---|---|---|
| CSS | |||
| 1 (mild) | 4,762 (85.5) | - | |
| 2 (severe) | 575 (10.3) | - | |
| 3 (death) | 234 (4.2) | - | |
| Age (yr) | |||
| ≤49 | 2,662 (47.8) | 1.13 [1.00, 1.00] | <0.01 |
| 50-69 | 2,044 (36.7) | 1.53 [1.00, 1.00] | |
| 70-79 | 542 (9.7) | 2.59 [1.00, 3.00] | |
| ≥80 | 323 (5.8) | 4.18 [1.50, 8.00] | |
| Sex | |||
| Female | 3,267 (58.6) | 1.52 [1.00, 1.00] | 0.05 |
| Male | 2,304 (41.4) | 1.70 [1.00, 1.00] | |
| BMI (kg/m2)1 | |||
| <25 | 3,136 (71.5) | 1.46 [1.00, 1.00] | <0.01 |
| ≥25 | 1,248 (28.5) | 1.62 [1.00, 1.00] |
| Characteristics |
Present |
Absent |
p-value | ||
|---|---|---|---|---|---|
| n (%) | CSS, mean [Q1, Q3] | n (%) | CSS, mean [Q1, Q3] | ||
| Symptom | |||||
| Fever | 1,297 (23.3) | 2.03 [1.00, 3.00] | 4,274 (76.7) | 1.47 [1.00, 1.00] | <0.01 |
| Cough | 2,324 (41.7) | 1.60 [1.00, 1.00] | 3,247 (58.3) | 1.60 [1.00, 1.00] | 0.10 |
| Sputum | 1,604 (28.8) | 1.67 [1.00, 1.00] | 3,967 (71.2) | 1.57 [1.00, 1.00] | <0.01 |
| ST | 869 (15.6) | 1.33 [1.00, 1.00] | 4,702 (84.4) | 1.65 [1.00, 1.00] | <0.01 |
| RNR | 614 (11.0) | 1.29 [1.00, 1.00] | 4,957 (89.0) | 1.64 [1.00, 1.00] | <0.01 |
| MAM | 915 (16.4) | 1.51 [1.00, 1.00] | 4,656 (83.6) | 1.61 [1.00, 1.00] | 0.87 |
| FM | 233 (4.2) | 1.97 [1.00, 3.00] | 5,338 (95.8) | 1.58 [1.00, 1.00] | <0.01 |
| HEADA | 961 (17.3) | 1.38 [1.00, 1.00] | 4,610 (82.7) | 1.64 [1.00, 1.00] | <0.01 |
| ACC | 32 (0.6) | 6.06 [4.25, 8.00] | 5,539 (99.4) | 1.57 [1.00, 1.00] | <0.01 |
| VN | 243 (4.4) | 1.95 [1.00, 3.00] | 5,328 (95.6) | 1.58 [1.00, 1.00] | <0.01 |
| DIARR | 515 (9.2) | 1.59 [1.00, 1.00] | 5,056 (90.8) | 1.60 [1.00, 1.00] | 0.87 |
| SOB | 662 (11.9) | 3.03 [1.00, 4.00] | 4,909 (88.1) | 1.40 [1.00, 1.00] | <0.01 |
| Comorbidity | |||||
| DM | 686 (12.3) | 2.50 [1.00, 3.00] | 4,885 (87.7) | 1.47 [1.00, 1.00] | <0.01 |
| HTN | 1196 (21.5) | 2.39 [1.00, 3.00] | 4,375 (78.5) | 1.38 [1.00, 1.00] | <0.01 |
| HF | 58 (1.0) | 3.88 [1.00, 8.00] | 5,513 (99.0) | 1.57 [1.00, 1.00] | <0.01 |
| CCD1 | 179 (3.2) | 2.61 [1.00, 3.00] | 5,376 (96.5) | 1.56 [1.00, 1.00] | <0.01 |
| Asthma | 128 (2.3) | 2.05 [1.00, 2.00] | 5,443 (97.7) | 1.59 [1.00, 1.00] | <0.01 |
| COPD | 40 (0.7) | 3.20 [1.00, 3.50] | 5,531 (99.3) | 1.59 [1.00, 1.00] | <0.01 |
| CKD | 55 (1.0) | 3.84 [1.00, 8.00] | 5,516 (99.0) | 1.58 [1.00, 1.00] | <0.01 |
| MALIG1 | 143 (2.6) | 2.36 [1.00, 3.00] | 5,427 (97.4) | 1.58 [1.00, 1.00] | <0.01 |
| CLD1 | 82 (1.5) | 1.99 [1.00, 2.75] | 5,166 (92.7) | 1.62 [1.00, 1.00] | <0.01 |
| RDAD1 | 38 (0.7) | 1.92 [1.00, 1.75] | 5,204 (93.4) | 1.63 [1.00, 1.00] | 0.37 |
| DEMEN1 | 224 (4.0) | 3.99 [2.00, 8.00] | 5,021 (90.1) | 1.52 [1.00, 1.00] | <0.01 |
CSS, clinical severity score; ST, sore throat; RNR, rhinorrhea; MAM, muscle ache; FM, fatigue; HEADA, headache; ACC, alteration of consciousness; VN, vomiting and nausea; DIARR, diarrhea; SOB, shortness of breath; DM, diabetes mellitus; HTN, hypertension; HF, heart failure; CCD, cardiac conduction disease; COPD, chronic obstructive pulmonary disease; CKD, chronic kidney disease; MALIG, malignancy; CLD, chronic liver disease; RDAD, rheumatic disease/autoimmune disorder; DEMEN, dementia; NA, not available.
1 Indicates variables with unavailable data points: CCD (16 NA), MALIG (1 NA), CLD (323 NA), RDAD (329 NA), DEMEN (326 NA).
Values are presented as estimate (95% confidence interval).
BMI, body mass index; DM, diabetes mellitus; HTN, hypertension; HF, heart failure; CCD, cardiac conduction disease; COPD, chronic obstructive pulmonary disease; CKD, chronic kidney disease; MALIG, malignancy; CLD, chronic liver disease; RDAD, rheumatic disease/autoimmune disorder; DEMEN, dementia.
1 Model 1 is adjusted for age, sex, and BMI only; Model 2 is additionally adjusted for all of the examined comorbidities.
- 1. Paules CI, Marston HD, Fauci AS. Coronavirus infections-more than just the common cold. JAMA 2020;323:707-708.ArticlePubMed
- 2. Fauci AS, Lane HC, Redfield RR. Covid-19 - navigating the uncharted. N Engl J Med 2020;382:1268-1269.ArticlePubMedPMC
- 3. World Health Organization. Estimating mortality from COVID-19; 2020 Aug 4 [cited 2021 Jun 10]. Available from: https://www.who.int/news-room/commentaries/detail/estimating-mortality-from-covid-19.
- 4. World Health Organization. Coronavirus disease (COVID-19) weekly epidemiological update and weekly operational update [cited 2021 Jun 10]. Available from: https://www.who.int/emergencies/diseases/novel-coronavirus-2019/situation-reports.
- 5. Wang X, Fang X, Cai Z, Wu X, Gao X, Min J, et al. Comorbid chronic diseases and acute organ injuries are strongly correlated with disease severity and mortality among COVID-19 patients: a systemic review and meta-analysis. Research (Wash D C) 2020;2020:2402961.ArticlePubMedPMC
- 6. Wadhera RK, Wadhera P, Gaba P, Figueroa JF, Joynt Maddox KE, Yeh RW, et al. Variation in COVID-19 hospitalizations and deaths across New York City boroughs. JAMA 2020;323:2192-2195.ArticlePubMedPMC
- 7. Richardson S, Hirsch JS, Narasimhan M, Crawford JM, McGinn T, Davidson KW, et al. Presenting characteristics, comorbidities, and outcomes among 5700 patients hospitalized with COVID-19 in the New York City area. JAMA 2020;323:2052-2059.ArticlePubMedPMC
- 8. Livingston E, Bucher K. Coronavirus disease 2019 (COVID-19) in Italy. JAMA 2020;323:1335.ArticlePubMed
- 9. Kashnitsky I, Aburto JM. COVID-19 in unequally ageing European regions. World Dev 2020;136:105170.ArticlePubMedPMC
- 10. Wang H, Zhang L. Risk of COVID-19 for patients with cancer. Lancet Oncol 2020;21:e181.ArticlePubMedPMC
- 11. Ji Y, Ma Z, Peppelenbosch MP, Pan Q. Potential association between COVID-19 mortality and health-care resource availability. Lancet Glob Health 2020;8:e480.ArticlePubMedPMC
- 12. Wu C, Chen X, Cai Y, Xia J, Zhou X, Xu S, et al. Risk factors associated with acute respiratory distress syndrome and death in patients with coronavirus disease 2019 pneumonia in Wuhan, China. JAMA Intern Med 2020;180:934-943.ArticlePubMed
- 13. Zhou F, Yu T, Du R, Fan G, Liu Y, Liu Z, et al. Clinical course and risk factors for mortality of adult inpatients with COVID-19 in Wuhan, China: a retrospective cohort study. Lancet 2020;395:1054-1062.ArticlePubMedPMC
- 14. Wu Z, McGoogan JM. Characteristics of and important lessons from the coronavirus disease 2019 (COVID-19) outbreak in China: summary of a report of 72 314 cases from the Chinese Center for Disease Control and Prevention. JAMA 2020;323:1239-1242.ArticlePubMed
- 15. Guan WJ, Liang WH, Zhao Y, Liang HR, Chen ZS, Li YM, et al. Comorbidity and its impact on 1590 patients with COVID-19 in China: a nationwide analysis. Eur Respir J 2020;55:2000547.ArticlePubMedPMC
- 16. Cramer AO, Waldorp LJ, van der Maas HL, Borsboom D. Comorbidity: a network perspective. Behav Brain Sci 2010;33:137-150.ArticlePubMed
- 17. Lee DS, Park J, Kay KA, Christakis NA, Oltvai ZN, Barabási AL. The implications of human metabolic network topology for disease comorbidity. Proc Natl Acad Sci U S A 2008;105:9880-9885.ArticlePubMedPMC
- 18. Yang J, Zheng Y, Gou X, Pu K, Chen Z, Guo Q, et al. Prevalence of comorbidities in the novel Wuhan coronavirus (COVID-19) infection: a systematic review and meta-analysis. Int J Infect Dis 2020;94:91-95.ArticlePubMedPMC
- 19. Sanyaolu A, Okorie C, Marinkovic A, Patidar R, Younis K, Desai P, et al. Comorbidity and its impact on patients with COVID-19. SN Compr Clin Med 2020;1-8.Article
- 20. Zhu L, She ZG, Cheng X, Qin JJ, Zhang XJ, Cai J, et al. Association of blood glucose control and outcomes in patients with COVID-19 and pre-existing type 2 diabetes. Cell Metab 2020;31:1068-1077.ArticlePubMedPMC
- 21. Atkins JL, Masoli JA, Delgado J, Pilling LC, Kuo CL, Kuchel GA, et al. Preexisting comorbidities predicting COVID-19 and mortality in the UK biobank community cohort. J Gerontol A Biol Sci Med Sci 2020;75:2224-2230.ArticlePubMedPMC
- 22. Ji W, Huh K, Kang M, Hong J, Bae GH, Lee R, et al. Effect of underlying comorbidities on the infection and severity of COVID-19 in Korea: a nationwide case-control study. J Korean Med Sci 2020;35:e237.ArticlePubMedPMC
- 23. Targher G, Mantovani A, Wang XB, Yan HD, Sun QF, Pan KH, et al. Patients with diabetes are at higher risk for severe illness from COVID-19. Diabetes Metab 2020;46:335-337.ArticlePubMedPMC
- 24. Singh AK, Gupta R, Ghosh A, Misra A. Diabetes in COVID-19: prevalence, pathophysiology, prognosis and practical considerations. Diabetes Metab Syndr 2020;14:303-310.ArticlePubMedPMC
- 25. Singh AK, Gupta R, Misra A. Comorbidities in COVID-19: outcomes in hypertensive cohort and controversies with renin angiotensin system blockers. Diabetes Metab Syndr 2020;14:283-287.ArticlePubMedPMC
- 26. Liang W, Guan W, Chen R, Wang W, Li J, Xu K, et al. Cancer patients in SARS-CoV-2 infection: a nationwide analysis in China. Lancet Oncol 2020;21:335-337.ArticlePubMedPMC
- 27. Schiffrin EL, Flack JM, Ito S, Muntner P, Webb RC. Hypertension and COVID-19. Am J Hypertens 2020;33:373-374.ArticlePubMed
- 28. Jordan RE, Adab P, Cheng KK. Covid-19: risk factors for severe disease and death. BMJ 2020;368:m1198.ArticlePubMed
- 29. Shahid Z, Kalayanamitra R, McClafferty B, Kepko D, Ramgobin D, Patel R, et al. COVID-19 and older adults: what we know. J Am Geriatr Soc 2020;68:926-929.ArticlePubMedPMCPDF
- 30. Shin EK, Shaban-Nejad A. Applied network science for relational chronic disease surveillance. Stud Health Technol Inform 2019;262:336-339.PubMed
- 31. Borgatti SP, Everett MG. Network analysis of 2-mode data. Soc Networks 1997;19:243-269.Article
- 32. Soper HE, Young AW, Cave BM, Lee A, Pearson K. On the distribution of the correlation coefficient in small samples. Appendix II to the papers of “Student” and RA Fisher. Biometrika 1917;11:328-413.Article
- 33. Hilbe JM. Logistic regression models. Hoboken: CRC Press; 2009. p 385-398.
- 34. Hosmer DW, Lemeshow S, Sturdivant RX. Applied logistic regression. Hoboken: John Wiley & Sons; 2013. p 369-311.
- 35. Agresti A. Categorical data analysis. New York: John Wiley & Sons; 2003. p 267-282.
- 36. Dietz W, Santos-Burgoa C. Obesity and its implications for COVID-19 mortality. Obesity (Silver Spring) 2020;28:1005.ArticlePubMed
- 37. Shin EK, Kwon Y, Shaban-Nejad A. Geo-clustered chronic affinity: pathways from socio-economic disadvantages to health disparities. JAMIA Open 2019;2:317-322.ArticlePubMedPMC
REFERENCES
Figure & Data
References
Citations
- SARS-CoV-2 susceptibility and COVID-19 illness course and outcome in people with pre-existing neurodegenerative disorders: systematic review with frequentist and Bayesian meta-analyses
Muhannad Smadi, Melina Kaburis, Youval Schnapper, Gabriel Reina, Patricio Molero, Marc L. Molendijk
The British Journal of Psychiatry.2023; 223(2): 348. CrossRef - Asthma and COPD as co-morbidities in patients hospitalised with Covid-19 disease: a global systematic review and meta-analysis
James Patrick Finnerty, A. B. M. Arad Hussain, Aravind Ponnuswamy, Hafiz Gulzeb Kamil, Ammar Abdelaziz
BMC Pulmonary Medicine.2023;[Epub] CrossRef - The Role of Diabetes and Hyperglycemia on COVID-19 Infection Course—A Narrative Review
Evangelia Tzeravini, Eleftherios Stratigakos, Chris Siafarikas, Anastasios Tentolouris, Nikolaos Tentolouris
Frontiers in Clinical Diabetes and Healthcare.2022;[Epub] CrossRef
 PubReader
 ePub Link
 Cite
Cite