
Articles
- Page Path
- HOME > Epidemiol Health > Volume 45; 2023 > Article
-
Original Article
Association of the dietary inflammatory index with phenotypic age in the United States adults -
Mengzi Sun1*
 , Jiaxin Fang1*, Wenhui Gao1, Yue He1, Yanan Ma2, Lina Jin1
 -
Epidemiol Health 2023;45:e2023051.
DOI: https://doi.org/10.4178/epih.e2023051
Published online: May 4, 2023
1Department of Epidemiology and Biostatistics, School of Public Health, Jilin University, Changchun, China
2Department of Biostatistics and Epidemiology, School of Public Health, China Medical University, Shenyang, China
- Correspondence: Lina Jin Department of Epidemiology and Biostatistics, School of Public Health, Jilin University, 163 Xinmin Street, Changchun 130021, China E-mail: jinln@jlu.edu.cn
- Co-correspondence: Yanan Ma Department of Biostatistics and Epidemiology, School of Public Health, China Medical University, 77 Puhe Road, Shenyang North New Area, Shenyang 110122, China E-mail: ynma@cmu.edu.cn
- *Sun & Fang contributed equally to this work as joint first authors.
© 2023, Korean Society of Epidemiology
This is an open-access article distributed under the terms of the Creative Commons Attribution License (http://creativecommons.org/licenses/by/4.0/), which permits unrestricted use, distribution, and reproduction in any medium, provided the original work is properly cited.
Abstract
-
OBJECTIVES
- One of the underlying mechanisms of aging is chronic inflammation, which has been closely associated with daily diet. Phenotypic age (PhenoAge) has been used as an index to track the aging process before diseases show clinical symptoms. The present study aimed to explore the association between the dietary inflammatory index (DII) and PhenoAge.
-
METHODS
- In total, 9,275 adults aged 20 years old and over in the National Health and Nutrition Examination Survey were involved in this study. Dietary patterns were classified as pro-inflammatory or anti-inflammatory according to the DII. PhenoAge was regarded as a continuous variable, and linear regression was used to explore its association with dietary inflammation. Stratified analyses by sex, age, race, physical exercise, smoking status, drinking status, and body mass index were used to test the sensitivity of these associations.
-
RESULTS
- The median value of PhenoAge was 38.60 years and 39.76 years for the participants with anti-inflammatory and pro-inflammatory diets, respectively. A pro-inflammatory diet was positively associated with PhenoAge (β=0.73; 95% confidence interval, 0.31 to 1.14), compared with participants who had an anti-inflammatory diet. There was an interaction between dietary inflammation and age for PhenoAge (pinteraction<0.001). The strength of the association between a pro-inflammatory diet and PhenoAge was stronger as age increased.
-
CONCLUSIONS
- A pro-inflammatory diet was associated with a higher PhenoAge, and the association was strongest in the elderly. We recommended reducing dietary inflammation to delay phenotypic aging, especially for the elderly.
- According to a 2019 report from the United Nations, 9% of people in the world are over 65 years of age, and by 2050 this number will rise to 16% [1]. The world will then experience an unsustainable burden of chronic diseases, which already extract a significant social and economic toll [2]. Aging involves changes in body composition, homeostatic mechanisms, energetics, and brain health over time. Therefore, aging could be reflected by a systematic analytical approach that integrates multiple biomarkers simultaneously, which could provide an opportunity to identify comprehensive biomarker signatures of aging [3,4]. Noteworthily, phenotypic age (PhenoAge) was developed as a novel multi-systembased aging measure capable of capturing mortality and morbidity risk in healthy individuals [5,6]. Previous studies have proven that PhenoAge could facilitate the identification of individuals at risk for various chronic diseases or causes of death [7].
- Chronic inflammation is a significant risk factor for morbidity and mortality in the elderly and a common molecular pathway for most age-related diseases [8]. It has been reported that diet is closely associated with inflammation, and inflammation might be a bridge that links diet and chronic diseases [9,10]. The dietary inflammatory index (DII) is a literature-derived score developed to evaluate the inflammatory potential of the diet and link diet to inflammation [11]. Meanwhile, the DII could serve as a quantitative measure for assessing the relationships between diet and health outcomes [12]. A cohort study indicated that a higher DII (indicating more significant pro-inflammatory diet potential) was associated with an increased risk of incident dementia [13], and a cross-sectional study indicated that the DII was positively associated with cognitive impairment in the elderly [14]. The DII was also associated with frailty and 8-year mortality risk in adults of all ages by another cohort study [15]. Moreover, an association was also found between DII and leukocyte telomere length (LTL) [16]. A previous study pointed out that nutritional issues play a vital role in age-associated diseases and substantially contribute to morbidity, disability, and mortality [17]; thus, it is necessary to form better nutritional habits to improve health outcomes.
- However, no studies have explored the association between DII and PhenoAge, especially for different age groups. In this study, we aimed to explore the association between dietary inflammation and aging via DII and PhenoAge in adults based on the National Health and Nutrition Examination Survey (NHANES), and we attempted to quantify the effect of a pro-inflammatory diet on aging. Furthermore, our results might provide a reference for specifying measurements for aging prevention.
INTRODUCTION
- Study population and protocol approval
- The NHANES is an ongoing cross-sectional survey that enrolls randomly selected participants for a comprehensive health screening every 2 years to generate a nationally representative sample [18]. A total of 32,464 participants aged over 20 were enrolled in NHANES from 1999 to 2010. After excluding participants who had missing data on PhenoAge, diet, and covariables, and who had extreme diet data, 9,275 participants were finally involved in the study. A flowchart is shown in Figure 1. We also described the characteristics of non-participants in Supplementary Material 1.
- Data measurement
- The PhenoAge calculation was proposed by Liu et al. [6] as a marker to track the aging process before diseases show clinical symptoms. PhenoAge was calculated using chronological age and 9 biomarkers (albumin, creatinine, glucose, log [C-reactive protein (CRP)], lymphocyte percent, mean cell volume, red blood cell distribution width, alkaline phosphatase, and white blood cell count). PhenoAge was selected through a Cox proportional hazards elastic net model for mortality based on 10-fold cross-validation [5,6], and PhenoAge was found to represent a person’s expected age within the population, consistent with a person’s estimated mortality hazard as a function of his/her profile of chemistry biomarkers [19]. The resulting final equation [20] to calculate PhenoAge is shown below:
- Where
- We used the revised version of the DII calculation developed by Shivappa et al. [11], and the specific algorithm has been detailed in a previous study. In this study, 26 nutrients were used to calculate the DII, including alcohol, vitamin B12/B6, β-carotene, caffeine, carbohydrate, cholesterol, total fat, fiber, folic acid, iron, magnesium, zinc, selenium, monounsaturated fatty acids, niacin, n-3 fatty acids, n-6 fatty acids, protein, polyunsaturated fatty acids, riboflavin, saturated fat, thiamin, and vitamins A/C/E. Importantly, even if fewer than 30 nutrients are applied, the DII can still be calculated. Participants were divided into those with an anti-inflammatory diet (DII<0) and those with a pro-inflammatory diet (DII≥0) [21].
- Body mass index (BMI) groups were defined into 3 categories: underweight and healthy weight (BMI < 25.0 kg/m2), overweight (25.0≤ BMI< 30.0 kg/m2), and obese (BMI ≥ 30.0 kg/m2) [22]. The physical activity level was measured with the Global Physical Activity Questionnaire [23] and divided into 3 groups (“inactive,” “moderate,” and “vigorous”) based on self-reported questions. Smoking status was divided into 3 categories: Non-smokers were defined as those who never smoked or smoked fewer than 100 cigarettes in their lifetime; former smokers were defined as those who had smoked at least 100 cigarettes but did not smoke now; and current smokers were defined as participants who had at smoked least 100 cigarettes and reported a non-zero number of cigarettes per day in the past 30 days [24]. The NHANES defined 1 alcohol-based drink as 12 ounces of beer, 4 ounces of wine, or 1 ounce of liquor. Drinking status was divided into 3 categories: nondrinkers were defined as participants who had consumed fewer than 12 alcohol-based drinks in the past year or lifetime; former drinkers were defined as participants who had consumed at least 12 drinks in their lifetime but not in the past year; and current drinkers were defined as participants who had at least 12 drinks in the past year and reported a non-zero number of drinks per week [24]. Moreover, the educational level was categorized into 3 groups: under high school, high school, and college degree or above. Income was measured by the ratio of family income to the poverty threshold.
- Statistical analysis
- The mean and standard error (SE) were used to describe continuous variables, and the unweighted frequency and weighted percentage were used to describe categorical variables. Multivariate linear regression was used to evaluate the associations between dietary inflammation and PhenoAge with adjustments. Sensitivity analyses were conducted via stratified analyses, and p-values for interaction between dietary inflammation and each stratified variable were also tested. All statistical analyses were conducted using SPSS version 24.0 (IBM Corp., Armonk, NY, USA) and R version 4.1.0 (R Foundation for Statistical Computing, Vienna, Austria), and the packages “forestplot” [25] and “survey” [26] were used. A 2-sided p-value < 0.05 was considered significant. All the analyses were performed using the complex sampling weight of NHANES.
- Ethics statement
- The institutional review board approved the protocols of the NHANES of the National Center for Health Statistics, Centers for Disease Control and Prevention. Written informed consent was obtained from each participant before participation in this study. The responsible committee of the Ethics Committee of the National Center for Health Statistics Research Ethics Review Board has approved the research protocol (ID: #98-12, #2005-06).
MATERIALS AND METHODS
Definition of PhenoAge
Definition of the DII
Covariate assessment
- Table 1 shows the basic characteristics of the 9,275 participants, of whom 4,496 had an anti-inflammatory diet and 4,779 had a pro-inflammatory diet. The median PhenoAge was 39.04 years, 38.60 years, and 39.76 years for the total participants, the participants with an anti-inflammatory diet, and the participants with a pro-inflammatory diet, respectively.
- We conducted univariate linear regression to test the relationships of variables with PhenoAge in adults, as shown in Table 2. The variables showed statistically significant associations with PhenoAge except for sex and income. Table 3 shows the association between dietary inflammation and PhenoAge in adults according to multivariate linear regression. Compared to participants with an anti-inflammatory diet, those with a pro-inflammatory diet had a PhenoAge in model 1 (pro-inflammatory diet: β= 1.78; 95% confidence interval [CI], 1.43 to 2.14). Similar results were observed in model 2 (pro-inflammatory diet: β= 1.38; 95% CI, 1.05 to 1.71) and model 3 (pro-inflammatory diet: β= 0.73; 95% CI, 0.31 to 1.14). A larger coefficient indicated a greater risk of the pro-inflammatory diet for higher PhenoAge.
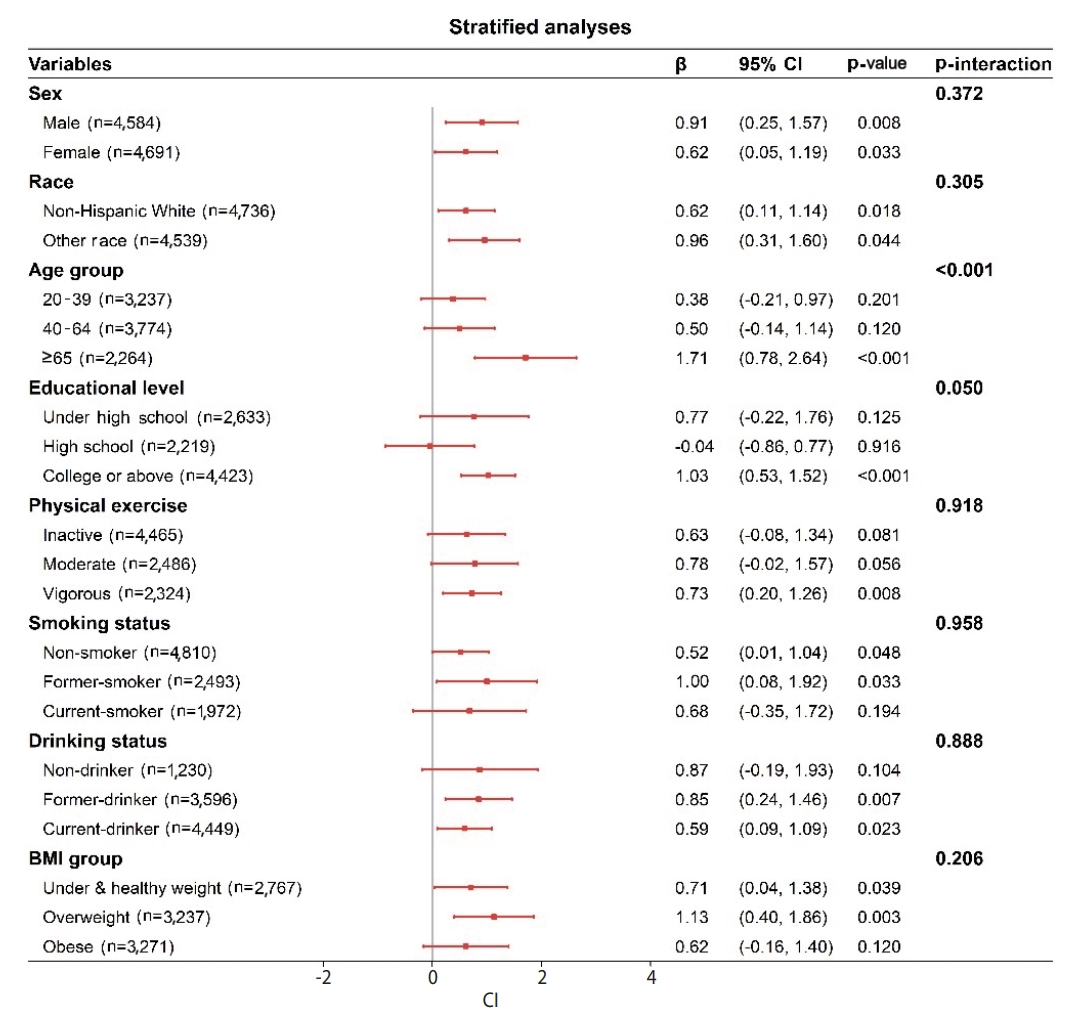
- As shown in the forest plot in Figure 2, the positive association between a pro-inflammatory diet and PhenoAge was robust after a stratified analysis. Noteworthily, there was an interaction between dietary inflammation and age on PhenoAge (pinteraction< 0.001). The association between a pro-inflammatory diet and PhenoAge was stronger as age increased. Moreover, we did not observe statistically significant interactions of dietary inflammation with sex, race, physical exercise, smoking status, drinking status, or BMI group on PhenoAge.
RESULTS
- In this study, we investigated the association between dietary inflammation and PhenoAge, and we found that a pro-inflammatory diet was significantly associated with a higher PhenoAge. Additionally, an interaction was found between a pro-inflammatory diet and age, with the strongest association between a pro-inflammatory diet and PhenoAge found in the elderly.
- No previous cohort or cross-sectional study has examined the relationship between the DII and PhenoAge. Our study was the first to do so, to the best of our knowledge. PhenoAge has been proven to be more than a measure of disease or morbidity; instead, it may be a marker that tracks the effect of aging before diseases become clinically evident [6]. Meanwhile, PhenoAge could capture pre-clinical aging and future morbidity/mortality risk, facilitate the evaluation of intervention efficacy, and avoid the need for decades of follow-up [27]. Based on the positive association observed between a pro-inflammatory diet and PhenoAge, we recommend following an anti-inflammatory diet to lower PhenoAge in the elderly, thereby preventing the adverse consequences of aging.
- Aging is a ubiquitous and complex phenomenon, and epidemiological evidence has indicated that elevated inflammatory biomarkers, including CRP and interleukin (IL)-6 could reflect a mild inflammatory state associated with many aging phenotypes [8]. “Inflamma-aging” is a common finding in aging and age-related disease that involves dysregulation of the cytokine network and its homeostasis [28]. The major pro-inflammatory cytokines, such as IL-6, tumor necrosis factor-alpha, and IL-1α, contribute significantly to inflammatory aging in healthy elderly individuals [29]. Moreover, based on the direct effect of pro-inflammatory cytokines on the muscle catabolic and anabolic signaling pathways, inflammation may contribute to the development of sarcopenia [30].
- Diet is an important and potentially easily modifiable risk factor for chronic disease [31]. There has been extensive interest in how dietary strategies can improve immunity in the elderly, and the nutritional approach is particularly suitable for the aging population [32]. Several previous studies have explored the associations between diet and aging, including caloric restriction diets [33,34], different dietary patterns such as the plant-based Mediterranean diet [17,35], and specific nutrients such as long-chain omega-3 fatty acids (docosahexaenoic acid and eicosapentaenoic acid) [36]. The lower cardiovascular disease risk found in populations with high adherence to the Mediterranean diet may be partly explained by the consumption of the Mediterranean diet reducing the postprandial inflammatory response in mononuclear cells compared with saturated fatty acid-rich and carbohydrate/polyunsaturated fatty acid-rich diets in older adults [37]. Another study proved that plant-based dietary patterns were associated with lower oxidative stress and inflammation levels, which may provide a reasonable approach for chronic disease prevention [38]. Although previous studies have focused on dietary patterns and different age-related diseases, they all support the association between a healthy diet and longevity.
- Moreover, dietary inflammation has been found to be positively associated with cognitive impairment, frailty, cardiometabolic risk, and other age-related diseases in previous studies [14,15,39]. Interestingly, some anti-aging nutrients are anti-inflammatory, such as vitamins A, D, E, and K and omega-3 fatty acids [40]. A previous study indicated that pro-inflammatory diets, which are typically high in refined grains, whole-fat dairy, red eat, total fat, and saturated fat, are positively associated with higher levels of inflammatory biomarkers [41]. It was reported that a higher DII was associated with a shorter LTL, an important aging biomarker [16]. The inflammatory potential of the diet was also related to incident frailty, slow walking, lower muscle mass, and poorer muscle function in older adults [42,43].
- There are some strengths and weaknesses of current research. As for the advantages, firstly, it was the first study focused on the DII and PhenoAge, which are combined indicators of dietary inflammation and aging, respectively. Secondly, our study could provide evidence to support preventing aging from a dietary perspective. Thirdly, our study was based on the NHANES, a nationally representative survey. As for the weaknesses, firstly, this was a cross-sectional study and might not enable robust causal inferences. Secondly, the study population was from the United States, and the conclusions may not be generalized to other populations. Thirdly, the 24-hour recall diet data may have been subject to recall bias. Furthermore, we need to expand the cohort study’s sample size to explore in-depth associations between dietary inflammation and PhenoAge and how dietary inflammation affects aging in the general population. Finally, the age of participants was slightly lower than the age of non-participants, which may have caused selection bias; thus, the PhenoAge may have been underestimated. However, we performed a sensitivity analysis to reanalyze the imputed data, and consistent findings were obtained.
DISCUSSION
- The data that support the findings of this study are openly available at https://www.cdc.gov/nchs/nhanes/. Information from NHANES is made available through an extensive series of publications and articles in scientific and technical journals. For data users and researchers throughout the world, survey data are available on the Internet and on easy-to-use CD-ROMs.
DATA AVAILABILITY
SUPPLEMENTARY MATERIALS
Supplement Material 1.
-
CONFLICT OF INTEREST
The authors have no conflicts of interest to declare for this study.
-
FUNDING
This work was supported by the Scientific Research Project of Education Department of Jilin Province, China (grant No. JJKH 20231145KJ).
-
AUTHOR CONTRIBUTIONS
Conceptualization: Sun M, Fang J, Jin L, Ma Y. Data curation: Sun M, Fang J. Formal analysis: Sun M, Fang J, Gao W, He Y. Funding acquisition: Jin L, Ma Y. Methodology: Sun M, Fang J. Project administration: Jin L, Ma Y. Visualization: Sun M, Fang J. Writing – original draft: Sun M, Fang J. Writing – review & editing: Sun M, Fang J, Gao W, He Y, Ma Y, Jin L.
NOTES
ACKNOWLEDGEMENTS

Values are presented as β (95% confidence interval).
NHANES, National Health and Nutrition Examination Survey; BMI, body mass index.
1 Model I: adjusted for age (years) and sex (male, female); Model II: adjusted for age (years), sex (male, female), race (non-Hispanic White, other), and BMI (kg/m2); Model III: adjusted for age (years), sex (male, female), race (non-Hispanic White, other), BMI, energy intake (kcal), smoking status (non-smoker, current smoker, former smoker), drinking status (non-drinker, current drinker, former drinker), physical exercise (inactive, moderate, vigorous), educational level (under high school, high school, college or above), and ratio of family income to the poverty threshold.
- 1. Alburez-Gutierrez D, Kolk M, Zagheni E. Women’s experience of child death over the life course: a global demographic perspective. Demography 2021;58:1715-1735.ArticlePubMedPDF
- 2. Chakravarti D, LaBella KA, DePinho RA. Telomeres: history, health, and hallmarks of aging. Cell 2021;184:306-322.ArticlePubMedPMC
- 3. Ferrucci L, Levine ME, Kuo PL, Simonsick EM. Time and the metrics of aging. Circ Res 2018;123:740-744.ArticlePubMedPMC
- 4. Sebastiani P, Thyagarajan B, Sun F, Schupf N, Newman AB, Montano M, et al. Biomarker signatures of aging. Aging Cell 2017;16:329-338.ArticlePubMedPMCPDF
- 5. Levine ME, Lu AT, Quach A, Chen BH, Assimes TL, Bandinelli S, et al. An epigenetic biomarker of aging for lifespan and healthspan. Aging (Albany NY) 2018;10:573-591.ArticlePubMedPMC
- 6. Liu Z, Kuo PL, Horvath S, Crimmins E, Ferrucci L, Levine M. A new aging measure captures morbidity and mortality risk across diverse subpopulations from NHANES IV: a cohort study. PLoS Med 2018;15:e1002718.ArticlePubMedPMC
- 7. Liu Z, Chen X, Gill TM, Ma C, Crimmins EM, Levine ME. Associations of genetics, behaviors, and life course circumstances with a novel aging and healthspan measure: evidence from the Health and Retirement Study. PLoS Med 2019;16:e1002827.ArticlePubMedPMC
- 8. Franceschi C, Campisi J. Chronic inflammation (inflammaging) and its potential contribution to age-associated diseases. J Gerontol A Biol Sci Med Sci 2014;69 Suppl 1:S4-S9.ArticlePubMed
- 9. Emerson SR, Kurti SP, Harms CA, Haub MD, Melgarejo T, Logan C, et al. Magnitude and timing of the postprandial inflammatory response to a high-fat meal in healthy adults: a systematic review. Adv Nutr 2017;8:213-225.ArticlePubMedPMC
- 10. Soory M. Nutritional antioxidants and their applications in cardiometabolic diseases. Infect Disord Drug Targets 2012;12:388-401.ArticlePubMed
- 11. Shivappa N, Steck SE, Hurley TG, Hussey JR, Hébert JR. Designing and developing a literature-derived, population-based dietary inflammatory index. Public Health Nutr 2014;17:1689-1696.ArticlePubMed
- 12. Tan QQ, Du XY, Gao CL, Xu Y. Higher dietary inflammatory index scores increase the risk of diabetes mellitus: a meta-analysis and systematic review. Front Endocrinol (Lausanne) 2021;12:693144.ArticlePubMedPMC
- 13. Charisis S, Ntanasi E, Yannakoulia M, Anastasiou CA, Kosmidis MH, Dardiotis E, et al. Diet inflammatory index and dementia incidence: a population-based study. Neurology 2021;97:e2381-e2391.ArticlePubMedPMC
- 14. Sun M, Wang L, Guo Y, Yan S, Li J, Wang X, et al. The association among inflammatory diet, glycohemoglobin, and cognitive function impairment in the elderly: based on the NHANES 2011-2014. J Alzheimers Dis 2022;87:1713-1723.ArticlePubMed
- 15. Jayanama K, Theou O, Godin J, Cahill L, Shivappa N, Hébert JR, et al. Relationship between diet quality scores and the risk of frailty and mortality in adults across a wide age spectrum. BMC Med 2021;19:64.ArticlePubMedPMCPDF
- 16. Shivappa N, Wirth MD, Hurley TG, Hébert JR. Association between the dietary inflammatory index (DII) and telomere length and C-reactive protein from the National Health and Nutrition Examination Survey-1999-2002. Mol Nutr Food Res 2017;61:10.1002/mnfr.201600630.ArticlePDF
- 17. Willcox DC, Scapagnini G, Willcox BJ. Healthy aging diets other than the Mediterranean: a focus on the Okinawan diet. Mech Ageing Dev 2014;136-137:148-162.ArticlePubMedPMC
- 18. Centers for Disease Control and Prevention. About the National Health and Nutrition Examination Survey. [cited 2023 Jan 10]. Available from: https://www.cdc.gov/nchs/nhanes/about_nhanes.htm.
- 19. Yang Z, Pu F, Cao X, Li X, Sun S, Zhang J, et al. Does healthy lifestyle attenuate the detrimental effects of urinary polycyclic aromatic hydrocarbons on phenotypic aging? An analysis from NHANES 2001-2010. Ecotoxicol Environ Saf 2022;237:113542.ArticlePubMed
- 20. Liu Z, Kuo PL, Horvath S, Crimmins E, Ferrucci L, Levine M. A new aging measure captures morbidity and mortality risk across diverse subpopulations from NHANES IV: a cohort study. PLoS Med 2018;15:e1002718.ArticlePubMedPMC
- 21. Davis JA, Mohebbi M, Collier F, Loughman A, Staudacher H, Shivappa N, et al. The role of diet quality and dietary patterns in predicting muscle mass and function in men over a 15-year period. Osteoporos Int 2021;32:2193-2203.ArticlePubMedPMCPDF
- 22. Physical status: the use and interpretation of anthropometry. Report of a WHO Expert Committee. World Health Organ Tech Rep Ser 1995;854:1-452.PubMed
- 23. Bull FC, Al-Ansari SS, Biddle S, Borodulin K, Buman MP, Cardon G, et al. World Health Organization 2020 guidelines on physical activity and sedentary behaviour. Br J Sports Med 2020;54:1451-1462.ArticlePubMed
- 24. Chang HJ, Lin KR, Lin MT, Chang JL. Associations between lifestyle factors and reduced kidney function in US older adults: NHANES 1999-2016. Int J Public Health 2021;66:1603966.ArticlePubMedPMC
- 25. Gordon M, Lumley T. forestplot: Advanced forest plot using ‘grid’ graphics version 3.1.1; 2022 [cited 2023 Jan 10]. Available from: https://cran.r-project.org/web/packages/forestplot/forestplot.pdf.
- 26. Lumley T. Analysis of complex survey samples version 4.2.1; 2023 [cited 2023 Jan 10]. Available from: https://cran.r-project.org/web/packages/survey/survey.pdf.
- 27. Hastings WJ, Shalev I, Belsky DW. Translating measures of biological aging to test effectiveness of geroprotective interventions: what can we learn from research on telomeres? Front Genet 2017;8:164.ArticlePubMedPMC
- 28. Rea IM, Gibson DS, McGilligan V, McNerlan SE, Alexander HD, Ross OA. Age and age-related diseases: role of inflammation triggers and cytokines. Front Immunol 2018;9:586.ArticlePubMedPMC
- 29. Franceschi C, Bonafè M, Valensin S, Olivieri F, De Luca M, Ottaviani E, et al. Inflamm-aging. An evolutionary perspective on immunosenescence. Ann N Y Acad Sci 2000;908:244-254.ArticlePubMed
- 30. Schaap LA, Pluijm SM, Deeg DJ, Visser M. Inflammatory markers and loss of muscle mass (sarcopenia) and strength. Am J Med 2006;119:526.e9-526.e17.ArticlePubMed
- 31. Lim SS, Vos T, Flaxman AD, Danaei G, Shibuya K, Adair-Rohani H, et al. A comparative risk assessment of burden of disease and injury attributable to 67 risk factors and risk factor clusters in 21 regions, 1990-2010: a systematic analysis for the Global Burden of Disease Study 2010. Lancet 2012;380:2224-2260.PubMedPMC
- 32. Weyh C, Krüger K, Strasser B. Physical activity and diet shape the immune system during aging. Nutrients 2020;12:622.ArticlePubMedPMC
- 33. Martel J, Chang SH, Wu CY, Peng HH, Hwang TL, Ko YF, et al. Recent advances in the field of caloric restriction mimetics and anti-aging molecules. Ageing Res Rev 2021;66:101240.ArticlePubMed
- 34. Pak HH, Haws SA, Green CL, Koller M, Lavarias MT, Richardson NE, et al. Fasting drives the metabolic, molecular and geroprotective effects of a calorie-restricted diet in mice. Nat Metab 2021;3:1327-1341.ArticlePubMedPMCPDF
- 35. Newman JC, Covarrubias AJ, Zhao M, Yu X, Gut P, Ng CP, et al. Ketogenic diet reduces midlife mortality and improves memory in aging mice. Cell Metab 2017;26:547-557.e8.ArticlePubMedPMC
- 36. Troesch B, Eggersdorfer M, Laviano A, Rolland Y, Smith AD, Warnke I, et al. Expert opinion on benefits of long-chain omega-3 fatty acids (DHA and EPA) in aging and clinical nutrition. Nutrients 2020;12:2555.ArticlePubMedPMC
- 37. Camargo A, Delgado-Lista J, Garcia-Rios A, Cruz-Teno C, Yubero-Serrano EM, Perez-Martinez P, et al. Expression of proinflammatory, proatherogenic genes is reduced by the Mediterranean diet in elderly people. Br J Nutr 2012;108:500-508.ArticlePubMed
- 38. Aleksandrova K, Koelman L, Rodrigues CE. Dietary patterns and biomarkers of oxidative stress and inflammation: a systematic review of observational and intervention studies. Redox Biol 2021;42:101869.ArticlePubMedPMC
- 39. Mazidi M, Shivappa N, Wirth MD, Hebert JR, Mikhailidis DP, Kengne AP, et al. Dietary inflammatory index and cardiometabolic risk in US adults. Atherosclerosis 2018;276:23-27.ArticlePubMed
- 40. Standish LJ. Textbook of functional medicine. J Altern Complement Med 2006;12:833-834.
- 41. Lopez-Garcia E, Schulze MB, Fung TT, Meigs JB, Rifai N, Manson JE, et al. Major dietary patterns are related to plasma concentrations of markers of inflammation and endothelial dysfunction. Am J Clin Nutr 2004;80:1029-1035.ArticlePubMed
- 42. Laclaustra M, Rodriguez-Artalejo F, Guallar-Castillon P, Banegas JR, Graciani A, Garcia-Esquinas E, et al. The inflammatory potential of diet is related to incident frailty and slow walking in older adults. Clin Nutr 2020;39:185-191.ArticlePubMed
- 43. Gojanovic M, Holloway-Kew KL, Hyde NK, Mohebbi M, Shivappa N, Hebert JR, et al. The dietary inflammatory index is associated with low muscle mass and low muscle function in older Australians. Nutrients 2021;13:1166.ArticlePubMedPMC
REFERENCES
Figure & Data
References
Citations
- The association between methylmalonic acid, a biomarker of mitochondria dysfunction, and phenotypic age acceleration: A population-based study
Bing Cao, Yu Xue, Dan Liu
Archives of Gerontology and Geriatrics.2024; 117: 105176. CrossRef - Association of pro-inflammatory diet with increased risk of gallstone disease: a cross-sectional study of NHANES January 2017–March 2020
Jinnian Cheng, Qian Zhuang, Weiyi Wang, Ji Li, Lu Zhou, Ying Xu, Haiqin Zhang, Zixu Zhang, Fengli Zhou, Daming Yang, Yimin Chu, Haixia Peng
Frontiers in Nutrition.2024;[Epub] CrossRef
 PubReader
 ePub Link
 Cite
Cite


