A hypertension risk score for adults: a population-based cross-sectional study from the Dubai Household Survey 2019
Article information

Abstract
OBJECTIVES
The aim of this study was to develop a risk score model for predicting hypertension specific to the population of Dubai in the United Arab Emirates (UAE) to facilitate prevention and early intervention.
METHODS
A retrospective analysis of data from the Dubai Household Health Survey 2019 was conducted. Demographic and physical parameters, as well as blood glucose levels, were included in the data. The risk factors for hypertension were identified using bivariate analysis. A risk score model was developed using the enter method, where all significant predictors of hypertension in bivariate analyses were entered in a single step with the primary outcome of hypertension status (yes/no). The model was validated internally by splitting the data into Emirati and non-Emirati populations.
RESULTS
A total of 2,533 subjects were studied. The significant risk factors for hypertension identified were male sex, older age (≥40 years), education level, body mass index, diabetes mellitus, and dyslipidaemia. The model showed a high discrimination ability between individuals with and without hypertension, with an area under the curve of 0.77 (95% confidence interval [CI], 0.75 to 0.79), excellent sensitivity (81.0%; 95% CI, 71.9 to 88.2) and moderate specificity (56.0%; 95% CI, 45.7 to 65.9).
CONCLUSIONS
The model developed by this study is simple, convenient, and based on readily available demographic and medical characteristics. This risk score model could support initial hypertension screening and provide an effective tool for targeted lifestyle counselling and prevention programs.
INTRODUCTION
High blood pressure (hypertension) is a global public health concern that causes high morbidity and mortality and a substantial economic burden. According to the World Health Organization (WHO), over 1 billion people throughout the world have hypertension, which increases their risk of ischaemic heart disease, stroke, and kidney disease [1]. Hypertension is a major cause of premature death worldwide, and its annual treatment cost was estimated to be over US$24 billion in 2018 [2].
The WHO reported that the WHO African Region had the highest prevalence of hypertension (27%) of all regions evaluated [1]. A recent study among the Emirati population living in the northern region of the United Arab Emirates (UAE) found a higher prevalence of hypertension (31%) [3]. An even higher prevalence of hypertension (34%) was found among expatriate male workers from South Asia living in the eastern region of the UAE [4]. Furthermore, a high burden of undiagnosed hypertension was reported in the UAE [5].
Modifiable hypertension risk factors exist at a high rate in the UAE population. The UAE has the highest prevalence of overweight and obesity, diabetes, and dyslipidaemia in the world due to several factors, including rapid urbanization, which can lead to sedentary lifestyles [3,6,7].
Epidemiological studies suggest that targeting persons at high risk of developing hypertension or treating it at an early stage may delay its onset or lessen its consequences, respectively [8-10]. Several studies have attempted to develop risk score models for predicting the development of hypertension or the presence of hypertension based on readily obtainable demographic and medical characteristics [11-15]. Evidence has indicated that the Framingham Heart Study risk score improved the prediction of incident hypertension and facilitated the identification of individuals who were at high risk of developing hypertension [16]. However, those studies might not be applicable to the Dubai population due to differences in genetic backgrounds, lifestyle factors, and environmental factors. Environmental and lifestyle factors, including food, obesity, physical activity, cigarette smoking, alcohol intake, and environmental contaminants, are increasingly being shown to alter epigenetic mechanisms and patterns in populations [17].
To the best of our knowledge, no studies in the UAE or in Dubai have used risk scores to predict the development of hypertension. The aim of this study was to develop a simple and informative risk score model appropriate for the Dubai population using factors that can be readily obtained. This risk score model could support initial hypertension screening and provide an effective tool for targeted lifestyle counselling and prevention programs.
MATERIALS AND METHODS
Study design
This study accessed data from the Dubai Household Health Survey (DHHS) that was conducted in 2019. The DHHS is a population-based cross-sectional questionnaire that was designed to assess the health status of the Dubai population. The main domains of DHHS are health behaviours, non-communicable diseases, healthcare delivery, and health expenditures. Residents in Dubai (Emirati and non-Emirati) were recruited for the DHHS using a complex stratified clustered random sampling technique.
Setting and participants
Dubai, with a population of around 3 million, is the second-largest city and Emirate in the UAE. Adults aged 18 and above, who account for roughly 80% of Dubai’s population, were the target population for the 2019 DHHS and were sampled using a cluster sampling method. The study sample available within the secondary data is limited to the number of respondents in the 2019 DHHS who received 3 successive measurements of systolic and diastolic blood pressure.
Variables and measurements
The socio-demographic variables included in this study included age, sex, marital status, nationality, education, occupation and work status, and lifestyle habits, including smoking, physical activity status and alcohol consumption. Weight, height, and systolic and diastolic blood pressures were measured to obtain participants’ body mass index (BMI) and blood pressure status. Diabetes status was determined based on haemoglobin A1c (HbA1c) cut-off measures. Participants were divided by age into 2 categories, 18-39 years and ≥ 40 years old. Marital status was categorised as married, single and divorced/separated/widowed. Nationality was categorised into Emirati and non-Emirati; and educational level was categorised as below secondary, secondary, and tertiary. Physical activity status was categorised as active and not active, with active participants engaging in at least 150 minutes of moderate-intensity aerobic physical activity throughout the week, at least 75 minutes of vigorous-intensity aerobic physical activity throughout the week, or an equivalent combination of moderate-intensity and vigorous-intensity physical activity [18]. Participants were defined as current smokers if they reported any type of tobacco smoking. Alcohol consumption was defined as any alcohol usage during the month preceding the survey. A BMI of < 25.0 kg/m2 was considered to indicate normal weight, 25.0-29.9 kg/m2 was defined as overweight, and ≥ 30.0 kg/m2 was considered indicative of obesity. Hypertension was defined as self-reported high blood pressure in the medications section and/or a blood pressure of ≥ 140/90 mmHg [19] as measured during the survey. Diabetes status was determined using an HbA1c test. The cut-off values for the test were defined as follows: < 6.5% was considered non-diabetes and ≥ 6.5% indicated diabetes [20]. Participants with self-reported diabetes in the medications section were also considered to have diabetes.
Data were collected by trained research assistants provided with standardised guidelines. Blood pressure was measured and recorded 3 times. The average of all 3 measurements was considered the most accurate and was thus recorded. Blood pressure was measured at 2 points in time after the first measurement, with 10-minute intervals between the measurements.
Statistical analysis
To describe the demographic and clinical characteristics of the population, frequencies (in percentages) for people with hypertension and those without hypertension were reported.
Bivariate analyses (chi-square) were conducted to identify the variables associated with hypertension. The non-statistically significant variables were eliminated. Statistical significance was set at p-value < 0.05.
Multiple binary logistic regression analyses were performed using the enter method, wherein all significant predictors of hypertension in the bivariate analyses were entered in a single step with the primary outcome of hypertension status (yes/no). The risk score for this study was calculated in 2 stages: First, a score was computed by multiplying the regression coefficients by 10 and rounding to the nearest integer for each significant variable in the multiple logistic regression analysis. Second, the risk score for an individual was calculated by adding the scores for each risk model variable. The estimated risk score was evaluated using a receiver operating characteristic (ROC) curve and the area under the curve (AUC) to derive a population cut-off based on optimising the sum of sensitivity and specificity. The data analysis was performed with IBM SPSS version 26 (IBM Corp., Armonk, NY, USA).
Reporting followed the STROBE (Strengthening the Reporting of Observational Studies in Epidemiology) statement for cross-sectional studies.
Ethics statement
The Dubai Scientific Research Ethics Committee, Dubai Health Authority, approved this study (DSREC-GL03-2021). A signed informed consent form was obtained from all participants.
RESULTS
There were 3,000 eligible subjects who participated in the study, of whom 2,533 (84.4%) had complete blood pressure data (Figure 1). Of the 2,533 study participants, 1,503 (59.3%) were male. The mean age of the entire sample was 40.8± 14.3 years old. Table 1 shows the characteristics of the study participants stratified into Emirati and non-Emirati groups and based on their hypertension status (yes/no). Bivariate analyses revealed variables that were significantly associated with hypertension (p≤0.05).

Flowchart of the study participants.
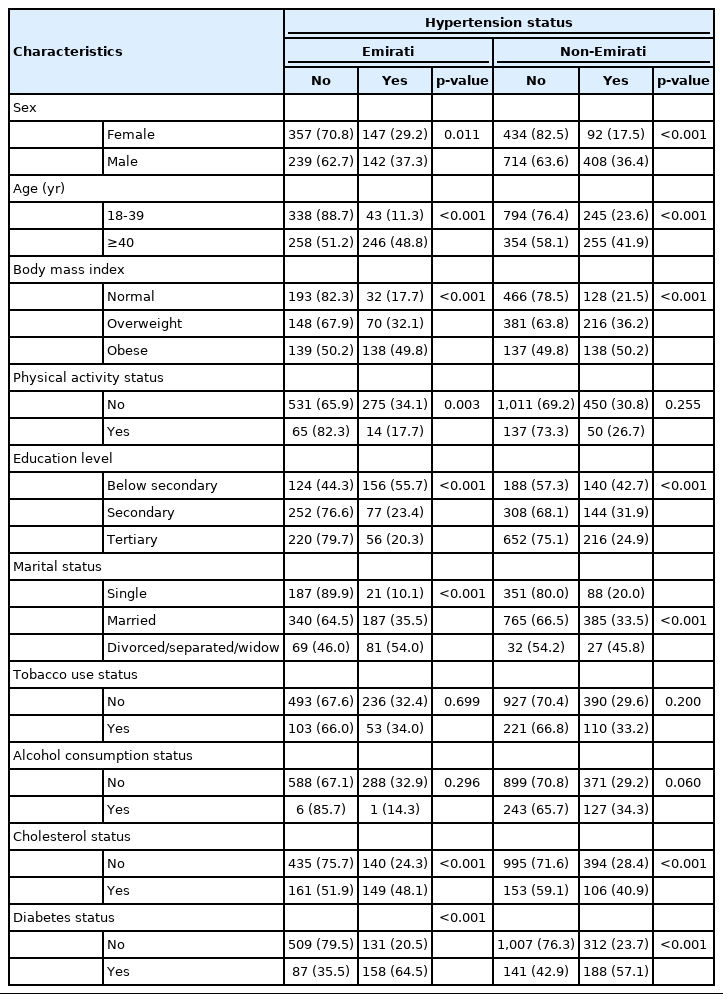
Characteristics of study subjects based on nationality and hypertension status
Tobacco use and alcohol consumption status were not statistically significantly associated with the presence of hypertension (p>0.05); therefore, these were excluded from our final models. Physical activity status and marital status were also excluded from our final models after stepwise forward modelling adjustment. The variables included in the final logistic regression models were sex, age, educational level, BMI group, dyslipidaemia status, and diabetes status, with the primary outcome of hypertension status (yes/no). Three binary logistic regression models were developed in this study: a binary logistic regression model to explore the factors associated with hypertension on the Emirati cohort; another model for the non-Emirati cohort and a combined model for both the Emirati and non-Emirati cohorts (Table 2). Being male (odds ratio [OR], 2.51; 95% confidence interval [CI], 2.01 to 3.15), over 40 years old (OR, 1.95; 95% CI, 1.57 to 2.42), or obese (OR, 3.12; 95% CI, 2.39 to 4.04) and having dyslipidaemia (OR, 1.62; 95% CI, 1.27 to 2.06), or diabetes (OR, 2.93; 95% CI, 2.33 to 3.70) were significant positive predictors of hypertension. Secondary education (OR, 0.58; 95% CI, 0.44 to 0.75) and tertiary education (OR, 0.48; 95% CI, 0.37 to 0.62) were significant negative predictors of hypertension (Table 2).
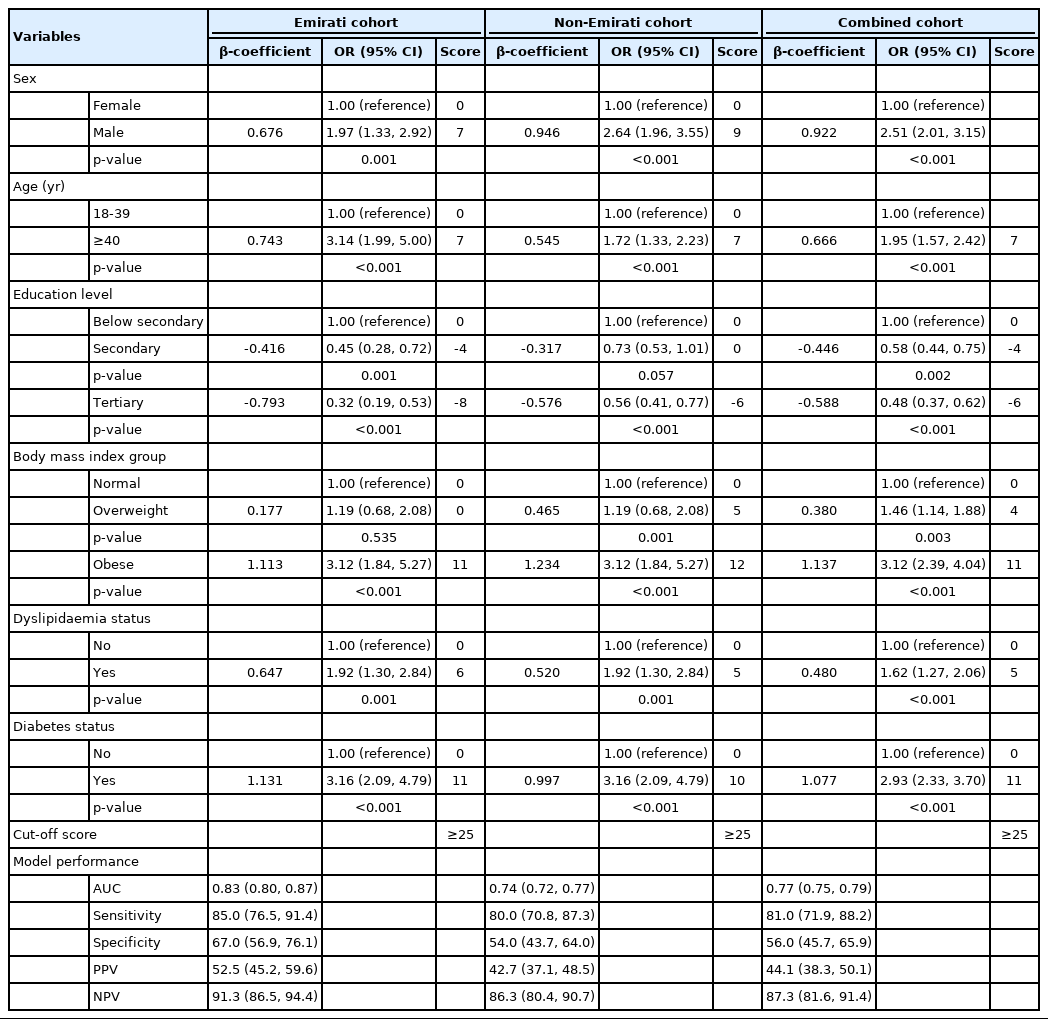
Binary logistic regression models for the Emirati cohort and non-Emirati cohort and their performance
Model validation and performance
Internal validation of the model was performed on the 2019 DHHS data. The data were split into 2 cohorts: Emirati and non-Emirati. Three regression models were developed for the 2 cohorts and the combined data (Table 2). The regression beta coefficient values obtained from the Emirati and non-Emirati models were highly similar to those of the combined model.
Table 2 also shows the performance characteristics of the 3 models. The Emirati model showed an excellent ability to discriminate between those with normal blood pressure and hypertension, with an AUC of 0.83 (Figure 2A), while the non-Emirati model showed an acceptable discrimination ability, with an AUC of 0.74 (Figure 2B), similar to the combined model, which had an AUC of 0.77 (Figure 2C). A cut-point of ≥ 25 was determined from the coordinates of the curve of each model in order to maximise the sum of sensitivity and specificity. The combined risk score showed an excellent sensitivity of 81% and a moderate specificity of 56% for predicting hypertension (Table 2).
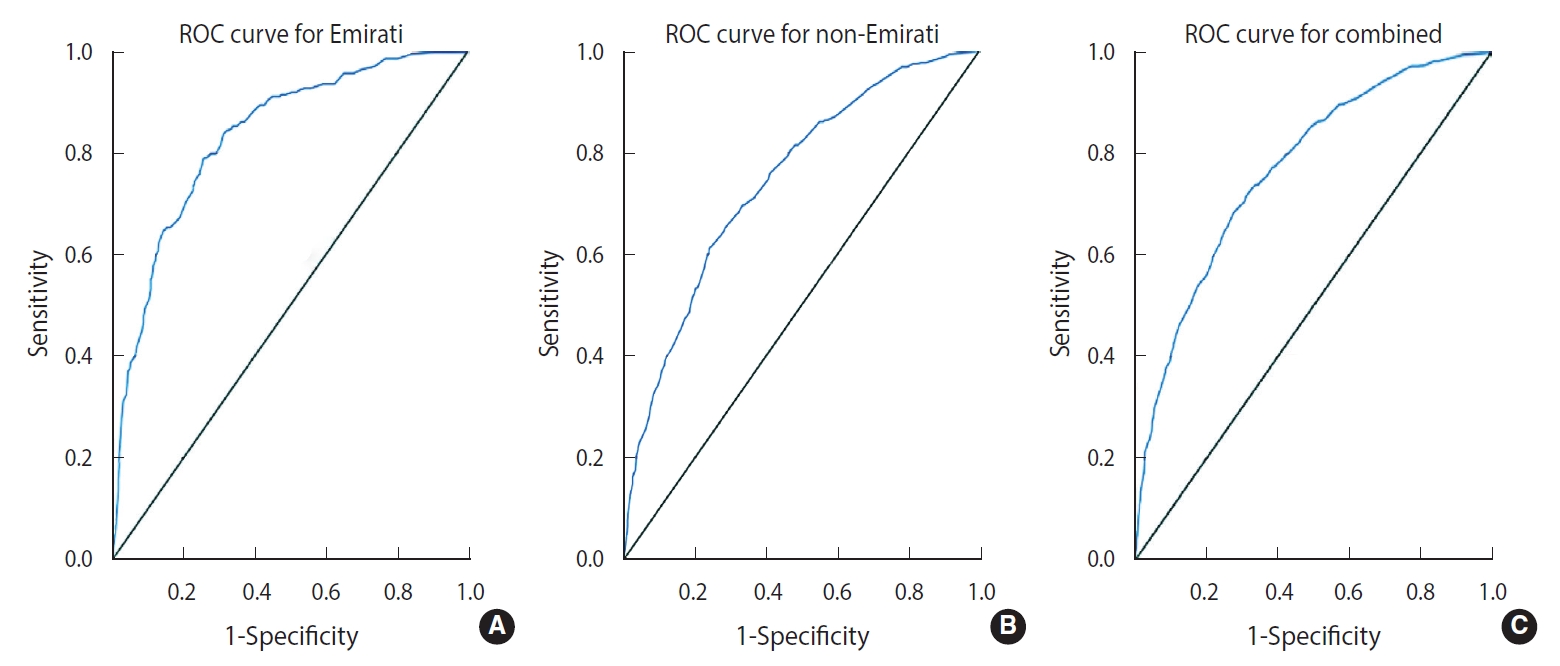
Receiver-operating characteristic (ROC) curves demonstrating the hypertension risk score model’s performance in predicting hypertension (A) Emirati, (B) non-Emirati, and (C) combined.
DISCUSSION
In the current study, a risk scoring algorithm to predict individuals in the UAE who are likely to develop hypertension was developed. We analytically assessed a set of factors that were identified in the literature as predictors for hypertension in order to develop a simple and convenient model. The study model indicated that obesity, diabetes, male sex, old age, and dyslipidaemia were strongly associated with an increased risk of hypertension, while tertiary education was inversely associated with hypertension. Our model showed a high capability of discriminating between individuals with and without hypertension, with high sensitivity and moderate to fair specificity. Our findings are consistent with those of several studies from the region and worldwide that have identified similar variables as predictors of hypertension [21-23].
The study identified a strong association between high educational attainment and a low risk of hypertension after controlling for possible confounders. Although the acquisition of education might not always translate into behavioural change, we propose that high educational attainment is often connected to individuals’ income, understanding of hypertension’s risk factors and consequences, and access to prevention methods. The effect of low educational attainment might continue even after the development of hypertension, as a study from Canada in patients with hypertension showed that those with low educational attainment were, in general, less likely to engage in lifestyle behaviours for blood pressure control [24,25].
Several studies have revealed that smoking and alcohol consumption are independent predictors of hypertension [21,26,27]. Interestingly, this study did not find a statistically significant association between hypertension and smoking or between hypertension and alcohol consumption in either Emirati or non-Emirati populations. We argue that these predictors might be under-reported in a conservative community like that of the UAE, particularly among females, as only 7 persons in the Emirati population in this study reported consuming alcohol. Furthermore, these factors might not be necessary for the development of hypertension, although they are important predictors in evaluating the risk of cardiovascular diseases [13].
Our combined model showed a high discrimination ability between individuals with and without hypertension, with an AUC of 0.77, which is similar to that in the Framingham Study model (0.78) [14], a Korean model (0.79) [12] and a Taiwanese model (0.73) [15]. Our Emirati model, however, showed a better discrimination, with an AUC of 0.83. Furthermore, the Emirati model explained 40.4% of the variability in predicting hypertension, while the non-Emirati model explained 22.0% of the variability and the combined model explained 26.0%. These differences in performance and explained variability between our models could be due to heterogeneity among non-Emirati respondents, who might have different predictors related to their ethnicities. In addition, the percentages of explained variability indicate that there are other influential predictors of hypertension, such as a family history of hypertension and dietary intake, that were not captured by the current study.
From a preventive medicine perspective, this scoring model can be used in Dubai by health professionals in clinical settings to provide targeted lifestyle counselling for people with normal blood pressure about their predicted risk of developing hypertension and discuss with them appropriate preventive measures. This study identified educational attainment as an important protective factor. Hypertension is a silent disease and is usually asymptomatic; thus, people with low educational attainment might not be fully aware of its risk factors and consequences. Clinicians should provide people with high predictable risk scores with appropriate preventive strategies, including health education and weight, diabetes, and dyslipidaemia control. Furthermore, the model can also be used as an initial screening tool to identify people at high risk of having undiagnosed hypertension.
The strength of this study was using 2 large, community-based, heterogeneous cohorts (Emirati and non-Emirati) to validate the prediction model, which showed a high capability of discriminating between those with and without hypertension. Moreover, this study reported the screening characteristics of the developed models, including sensitivity, specificity, positive predictive value, and negative predictive value, which to our knowledge were not reported in previously published studies [12,13,15].
There were some limitations to this study, including that temporality between the predictors and hypertension cannot be established due to its cross-sectional design. Furthermore, the study data were not specifically collected for risk modelling purposes; as a result, some important demographic predictors, such as a family history of hypertension and dietary intake, were not assessed in this study. In addition, the study is based on data from residents of Dubai, who might not be representative of the entire UAE population.
In conclusion, this study developed a risk score model that is unique and suitable to predict the risk of developing hypertension for Emirati and non-Emirati populations living in Dubai in the UAE. It offers a simple and convenient tool based on readily available demographic and medical characteristics that can easily be used in clinical settings. This risk score model could support initial hypertension screening and provide an effective tool for targeted lifestyle counselling and prevention programs. Clinicians should provide people with high risk scores with appropriate preventive strategies, including health education and weight, diabetes, and dyslipidaemia control. We recommend conducting a prospective study that would include all emirates in the UAE to ensure generalisability, with the collection of additional predictors of hypertension and the inclusion of measurements taken over time.
Notes
CONFLICT OF INTEREST
The authors have no conflicts of interest to declare for this study.
Funding
None.
AUTHOR CONTRIBUTIONS
Conceptualization: IM, NS, AH. Data curation: IM. Formal analysis: IM. Funding acquisition: None. Methodology: HM, WKA, HYH, GMI. Writing – original draft: IM. Writing – review & editing: IM, NS, AH, HM, WKAN, HYH, GMI.
Acknowledgements
The authors would like to express their gratitude to the Dubai Statistics Centre team for their invaluable contribution to the Dubai Household Health Survey.