
Articles
- Page Path
- HOME > Epidemiol Health > Volume 45; 2023 > Article
-
Original Article
A comparison of methods for the measurement of adherence to antihypertensive multidrug therapy and the clinical consequences: a retrospective cohort study using the Korean nationwide claims database -
Minji Jung1*
 , Eunjung Choo2*, Sukhyang Lee2
 -
Epidemiol Health 2023;45:e2023050.
DOI: https://doi.org/10.4178/epih.e2023050
Published online: May 1, 2023
1Department of Urology, School of Medicine, Stanford University, Palo Alto, CA, USA
2Division of Clinical Pharmacy, Ajou University College of Pharmacy, Suwon, Korea
- Correspondence: Sukhyang Lee Division of Clinical Pharmacy, Ajou University College of Pharmacy, 206 Worldcup-ro, Yeongtong-gu, Suwon 16499, Korea E-mail: suklee@ajou.ac.kr
- *Jung & Choo contributed equally to this work as joint first authors.
© 2023, Korean Society of Epidemiology
This is an open-access article distributed under the terms of the Creative Commons Attribution License (http://creativecommons.org/licenses/by/4.0/), which permits unrestricted use, distribution, and reproduction in any medium, provided the original work is properly cited.
- 3,450 Views
- 111 Download
Abstract
-
OBJECTIVES
- In observational studies, the methods used to measure medication adherence may affect assessments of the clinical outcomes of drug therapy. This study estimated medication adherence to multidrug therapy in patients with hypertension using different measurement methods and compared their impacts on clinical outcomes.
-
METHODS
- This was a retrospective cohort study using the Korean National Health Insurance Service–National Sample Cohort database (2006-2015). Adults diagnosed with hypertension who initiated multidrug antihypertensive therapy in the index year 2007 were included. Adherence was defined as over 80% compliance. Adherence to multidrug antihypertensive therapy was measured in 3 ways using the proportion of days covered (PDC) with 2 approaches to the end-date of the study observations: PDC with at least one drug (PDCwith≥1), PDC with a duration weighted mean (PDCwm), and the daily polypharmacy possession ratio (DPPR). The primary clinical outcome was a composite of cardiovascular and cerebrovascular disease-specific hospitalizations or all-cause mortality.
-
RESULTS
- In total, 4,226 patients who initiated multidrug therapy for hypertension were identified. The mean adherence according to the predefined measurements varied from 72.7% to 79.8%. Non-adherence was associated with an increased risk of a primary outcome. The hazard ratios (95% confidence intervals, CIs) primary outcomes varied from 1.38 (95% CI, 1.19 to 1.59) to 1.44 (95% CI, 1.25 to 1.67).
-
CONCLUSIONS
- Non-adherence to multidrug antihypertensive therapy was significantly associated with an increased risk of a primary clinical outcome. Across the varying estimates based on different methods, medication adherence levels were similar. These findings may provide evidence to support decision-making when assessing medication adherence.
- Adherence to medications is defined as the extent to which a patient takes medications according to the prescribed dosage, frequency, and duration [1-4]. Non-adherence is associated with an increased risk of clinical consequences and suboptimal therapeutic effects [5-7], and it is related to an estimated US$100-300 billion annually in potentially avoidable healthcare costs, accounting for 10% of total healthcare costs [8,9]. Therefore, adherence to medication is one of the key measurements used to optimize therapeutic effects, lower the risk of clinical consequences, and decrease the health care burden.
- Hypertension, one of the most common chronic diseases worldwide, is particularly challenging because patients require long-term medications to maintain their blood pressure within the target range and to prevent clinical consequences such as cardio-cerebrovascular disease (CVD) [10]. In Korea, approximately 63% (9.7 million) of patients with a diagnosis of hypertension received antihypertensive medications in 2018, approximately 4 times higher than in 2002 [11]. However, half did not adhere to their medications, with a standard threshold of 80%. Furthermore, approximately 60% needed multidrug therapy, a known risk factor for medication non-adherence related to the increased complexity of the regimen [12-14]. With the growing use of antihypertensive medications, improved adherence to these medications, especially in multidrug therapy settings, can lead to improved clinical and economic healthcare outcomes [15].
- To improve adherence to multidrug therapy, it is necessary to standardize the methods used to measure adherence. However, there are 2 barriers to measuring adherence. First, numerous studies have used different adherence measurements. Currently, the proportion of days covered (PDC) is suggested by the Pharmacy Quality Alliance as the preferred measurement for adherence to antihypertensive medications [16]. The validity of the PDC in monotherapy has been proved in various studies; however, it remains unclear whether it is applicable in multidrug therapy settings [17]. Over the past decade, several concepts and definitions of adherence have been suggested. Various PDC-based methods have been used for multidrug therapy, such as PDC with at least 1 drug (PDCwith≥1) and PDC with a duration-weighted mean (PDCwm) [17-19]. Recently, the daily polypharmacy possession ratio (DPPR) was proposed to assess adherence to multidrug therapy [17,20]. However, these methods have not been comprehensively compared. Second, the results of studies analyzing various approaches to medication use have been inconsistent [17,21,22]. Observational studies have reported that patients took their medications as prescribed, that patients refilled prescriptions before their previous supply was depleted, or that patients took extra doses accumulated during the observation period [21,22]. Nevertheless, the comparative validity of these results remains unclear.
- In a previous study we compared the 3 abovementioned measurements of adherence to antihypertensive medications and developed an algorithm of 8 different approaches incorporating 25 alternative assumptions [22]. We suggested that PDCwith≥1 could be the preferred option. We also found that the end-date of the study’s observation period, as with prescription-based methodologies (PxMs) or fixed period-based methodologies (FxMs), may influence the measurements of adherence. However, these findings relied on samples that used both single-drug and multidrug regimens, and we did not study them separately. Therefore, the present study aimed to compare 3 measurements of adherence, including PDCwith≥1, PDCwm, and DPPR, across 2 approaches to defining the end-date of the study observations (PxM and FxM) in patients receiving multidrug antihypertensive therapy and investigate their clinical consequences.
INTRODUCTION
- Data source
- The Korean National Health Insurance Service (NHIS) provides coverage for over 97% of the Korean population [23]. The Korean National Health Insurance Service–National Sample Cohort (NHIS–NSC) database from 2006 to 2015 includes data from approximately 1 million Koreans sampled among all beneficiaries [23,24]. The NHIS-NSC contains data on patient demographics including age and sex, diagnostic records, and prescription records from both inpatient and outpatient settings. The diagnostic records were coded according to the International Classification of Diseases, 10th revision (ICD‐10). The prescription records were coded according to the Korean Drug and Anatomical Therapeutic Chemical Codes. The need for informed consent was waived, as all data in the NHIS-NSC were anonymized before the database was provided.
- Study population
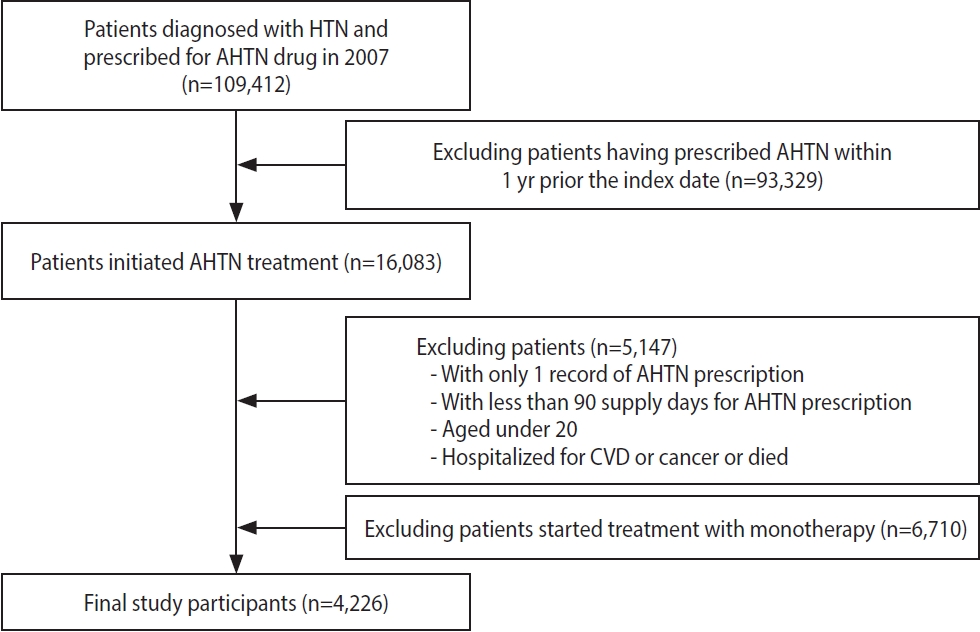
- In this nationwide retrospective cohort study, we included patients aged > 20 years who had a diagnosis of hypertension and at least 2 prescriptions for antihypertensive medications (i.e., multidrug therapy) from 2 or more classes of drugs in the index year 2007. We included 5 classes of antihypertensive medications: angiotensin-converting enzyme inhibitors, angiotensin receptor blockers, beta-blockers, calcium channel blockers, and diuretics. The index date was the date of the patient’s first prescription for antihypertensive medications. We assessed adherence to the medications for 3 years from the index date (Figure 1). The following patients were excluded: (1) those who had a prescription record of antihypertensive medications within 1 year before the index date, (2) those who had a prescription record of a single antihypertensive medication (monotherapy), (3) those who had used antihypertensive medications for < 90 days, (4) those who had been hospitalized with a diagnosis of CVD or cancer within 1 year before the index date, and (5) those who died or developed CVD or cancer within 3 years after the index date (Figure 2).
- Measurements of adherence
- The aim of this study was to measure the patients’ adherence to multidrug antihypertensive therapy. Multidrug antihypertensive therapy was defined as 2 or more medications from the 5 drug classes, prescribed from the index date for a period of 3 years to reflect chronic treatment. We categorized study participants into 2 groups with a cut-off value of 80%: adherent patients (≥ 80%) and non-adherent patients (< 80%) [25].
- To compare the measurements of adherence to multidrug antihypertensive therapy and their clinical consequences, we included PDCwith≥1, PDCwm, and DPPR, which had been analyzed in our previous study [17-20,22]. First, PDCwith≥1 was calculated as the number of days covered by ≥ 1 prescription during the observation period, divided by the number of days from the first prescription to the end of the observation period [17,19]. Second, PDCwm was calculated as the sum of values obtained by multiplying the PDC of each drug class by its duration weight, divided by the sum of the weights [17,18]. Third, DPPR was calculated as the sum of each day’s score, which was a ratio of the number of drugs available for the day to the number of drug classes to be taken for the day, divided by the number of days in the observation period [17,20]. Detailed explanations are presented in Supplementary Material 1.
- In addition, we compared 2 approaches (PxM and FxM) to defining the end-date of the study, which had been shown to be a potentially significant factor when measuring adherence in previous studies [22,26-28]. The PxM approach assumes that a patient takes the medication from the first prescription fill to the end of the supply of the last refill, while the FxM approach assumes that a patient takes the medication during the entire observation period (Supplementary Material 1). We derived 6 estimates by combining the 3 adherence measurements with the 2 approaches to the end-date. We also examined the adherence estimates stratified by sex, a factor for which previous studies have reported inconsistent findings.
- Study outcome
- The primary outcome was a composite of CVD-related hospitalizations and all-cause mortality. CVD was defined as a code for ischemic heart disease (ICD-10 codes I20-I25), cardiovascular diseases (ICD-10 codes I05-I09, I26-I28, I30-I52), stroke (ICD-10 codes I60-I64), and cerebrovascular diseases (ICD-10 codes I65-I69, G45-G46) [29]. The secondary outcomes were all-cause mortality, CVD-related mortality, and CVD-related hospitalization. The cause of death was obtained using the ICD-10 codes applied by Statistics Korea in this study database, and by individually linking the information using a unique personal identification number [30]. Previous validation studies have shown high positive predictive values (> 90%) for the outcomes [29,31,32]. Each patient was followed from the index date until the occurrence of a primary or secondary outcome or the end-date of the study’s observation period (December 31, 2015), whichever came first.
- Covariates
- The baseline characteristics included sex, age, disability, type of health insurance, socioeconomic status, type of medical institution, type of multidrug therapy, Charlson comorbidity index (CCI) score, and history of diabetes mellitus or dyslipidemia within 1 year prior to the index date [29]. Categories were defined for age (20-49, 50-69, and > 70 years), type of health insurance (National Health Insurance or Medical Aid), socioeconomic status (high, moderate, low, and missing data), and medical institution (tertiary, secondary, clinic, and public health center). The type of multidrug therapy, based on the number of antihypertensive medication classes, was categorized as dual therapy or ≥ triple therapy. To estimate the individual medical burdens of disease, the CCI was categorized as 0, 1, or ≥ 2.
- Statistical analysis
- In the main analysis, we presented mean (standard deviation) and median (interquartile range, IQR) values for adherence levels and the numbers of adherent patients. We used Cox proportional hazards analysis to model the time to the primary outcome as a dependent variable, and the measurement of adherence as the independent variable. We adjusted the model for sex and age, and fully adjusted it for sex, age, disability, type of health insurance, socioeconomic status, type of medical institution, type of multidrug therapy, CCI score, and history of diabetes mellitus or dyslipidemia. To test the goodness-of-fit for the risk models in survival analyses, we compared the Akaike information criterion (AIC) and concordance indexes including Harrell’s and Uno’s C-index. The AIC was used to evaluate predictive performance. While Harrell’s C-index has been shown to have an upward bias if a large volume of patients is censored, Uno’s C-index has shown less bias in such situations. These C-indexes were used to assess differences between the unadjusted base model and the models adjusted for the 6 measurements of adherence. A C-index of > 0.7 was considered a good model and higher estimates when compared to the base model were considered better. A p-value of < 0.05 was considered to indicate statistical significance. All data analyses were conducted using SAS version 9.4 (SAS Institute Inc., Cary, NC, USA).
- Ethics statement
- This study protocol was approved by the Institutional Review Board (IRB) of Ajou University, Korea (201912-HB-EX-001). Informed consent was waived by the IRB.
MATERIALS AND METHODS
- Among the study population of 4,226 patients who had a diagnosis of hypertension and initiated multidrug antihypertensive therapy in 2007, 47.4% were female, 37.2% were > 60 years old, 7.4% had a disability, 94.4% had National Health Insurance, and 37.9% had a high-income level. A total of 3,273 patients (77.4%) took 2 antihypertensive medications and 22.6% took ≥ 3 medications. Approximately 15.4% and 31.0% had a history of diabetes mellitus and dyslipidemia, respectively (Table 1). A comparison of the baseline characteristics between the adherent and non-adherent groups according to PDCwith≥1, PDCwm, and DPPR are shown in Supplementary Materials 2-7.
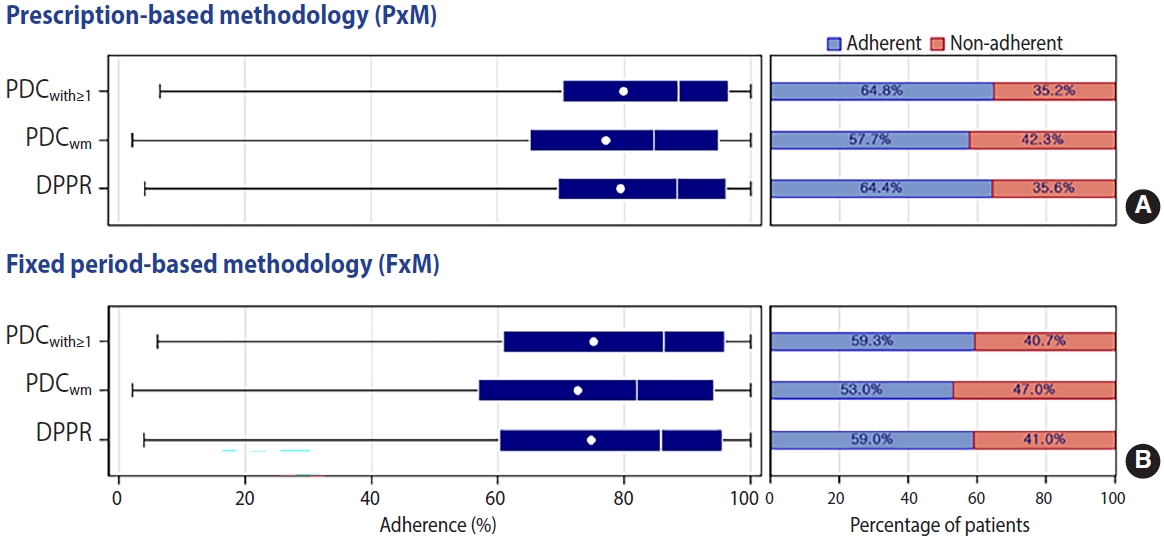
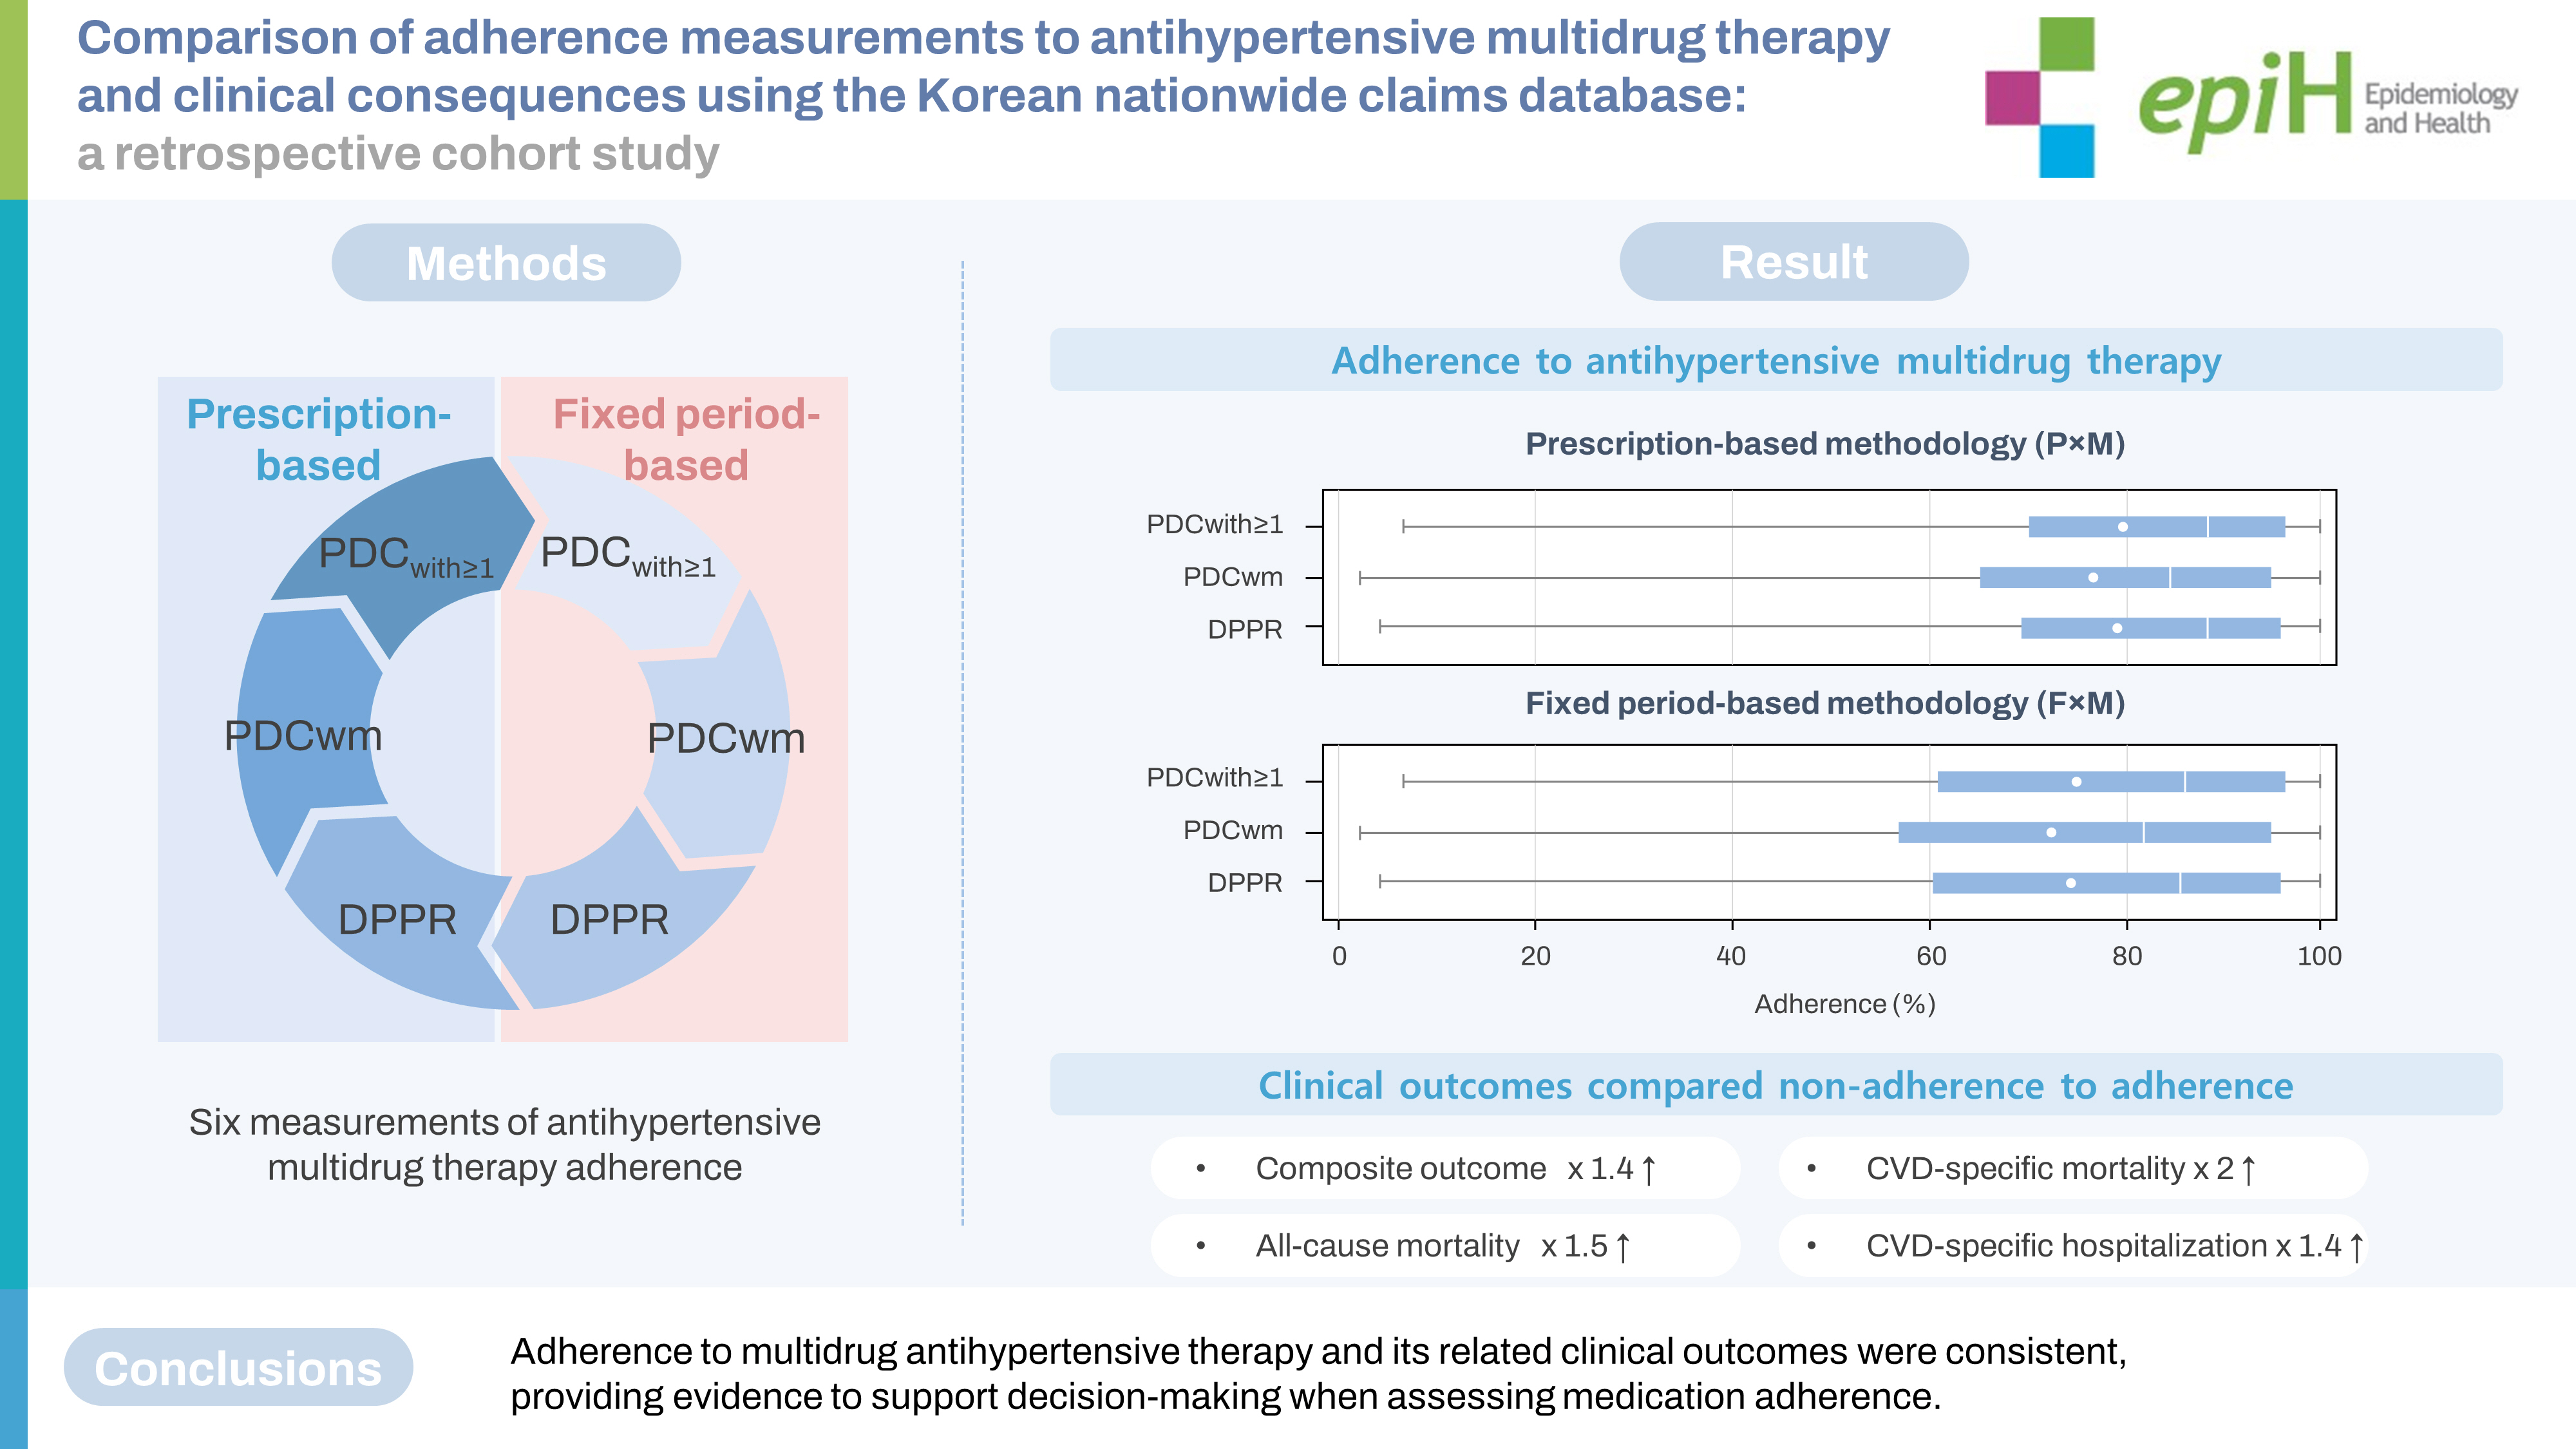
- The results of PDCwith≥1, PDCwm, and DPPR showed that, according to PxM and FxM, a total of 2,739 (64.8%) and 2,506 (59.3%), 2,440 (57.7%) and 2,240 (53.0%), and 2,720 (64.4%) and 2,493 (59.0%) patients were adherent, respectively. The mean values of adherence varied from 72.7% to 79.8% (Table 2 and Figure 3). Estimates of adherence were similar between sexes (Supplementary Material 8).
- Compared to the adherent group, the non-adherent group was significantly associated with an increased risk of a primary outcome. The 6 estimates of adherence levels varied from the fully adjusted hazard ratio (HR) of 1.38 (95% confidence intervals [CI], 1.19 to 1.59) to an HR of 1.44 (95% CI, 1.25 to 1.67). The estimates of adherence related to the risks of all-cause mortality were from (HR, 1.48; 95% CI, 1.16 to 1.89) to (HR, 1.65; 95% CI, 1.30 to 2.10). The risks of CVD-related mortality varied from (HR, 1.95; 95% CI, 1.20 to 3.18) to (HR, 2.53; 95% CI, 1.52 to 4.23). The risks of CVD-related hospitalization differed from (HR, 1.40; 95% CI, 1.20 to 1.64) to (HR, 1.45; 95% CI, 1.24 to 1.70) (Table 3). In the fully adjusted models, the AIC was lower, and Harrell’s and Uno’s C-indexes were higher than 0.7 across the 6 estimates, including the 3 measurements of adherence with FxM and PxM (Table 4, Supplementary Material 9).
RESULTS
- This population-based cohort study compared the 3 measurements of adherence to multidrug antihypertensive therapy (PDCwith≥1, PDCwm, and DPPR) across 2 approaches to defining the end-date of observations (PxM and FxM), and their comparative clinical outcomes. This study found that (1) the adherence estimates of PDCwith≥1, PDCwm, and DPPR were similar, (2) these trends were consistently shown in both the PxM and FxM approaches, and (3) non-adherence was associated with a 40% increased risk of a primary outcome. To the best of our knowledge, this is the first study to compare the different approaches for measuring adherence to multidrug antihypertensive therapy over a 3-year period and to identify their clinical outcomes using a Korean nationwide claims database.
- In this study, median adherence levels of > 80% to multidrug antihypertensive therapy were shown across the 6 estimates. The percentage of adherent study subjects varied from 53.0% to 64.8%. Although the Korean Society of Hypertension reported in their 2018 fact sheet that 49.5% of adults were adherent to antihypertensive medications in 2007, the index year of the current study, they did not present how adherence was measured [11]. Although the percentage has increased from 24.0% in 2002 to 72.1% in 2018 because of the growing number of patients with hypertension and a longer life expectancy, optimizing adherence to medications is paramount.
- PDCwith≥1, PDCwm, and DPPR showed similar adherence levels. As there were no previous studies comparing these 3 measurements in multidrug antihypertensive therapy, it is difficult to directly compare to previous studies. Our previous study of patients receiving both antihypertensive single and multidrug regimens showed similar trends [22]. However, a previous study comparing adherence to antidiabetic therapy showed different trends; the median value (IQR) of adherence was 95.9% (IQR, 72.3-100) and 77.5% (IQR, 51.8-96.4) when using PDCwith≥1 and DPPR, respectively [33]. Although PxM showed slightly higher estimates than FxM, similar trends were shown in both. Other studies have supported our findings [18,25,34]. In studies of chronic medication therapy, the study observation window, which is the denominator in calculating adherence, was generally shorter in the FxM approach than in the PxM approach. These findings demonstrated that different measurements and approaches to evaluating medication adherence could contribute to differing results. Identifying a reasonable range of adherence levels would help minimize the sample size necessary for clinical trials or observational research, especially when enrolling subjects with chronic and multidrug therapy, who tend to be less adherent.
- As expected, non-adherence to multidrug antihypertensive therapy was significantly associated with a 40% increased risk of the primary clinical outcomes. Moreover, these associations were also largely consistent across the 6 estimates for individual outcomes. Interestingly, the HRs increased with adjustments to the covariates. This could be explained by age (> 50 years), type of multidrug therapy (≥ triple therapy), and the presence of diabetes or dyslipidemia, which were negatively related to non-adherence, and positively related to the study outcomes of mortality or hospitalization (Supplementary Materials 2-7). These findings were in line with other studies [5-7,35]. A meta-analysis showed that adherence to cardiovascular medications including antihypertensive medications, antiplatelet drugs, and statins was associated with 44%, 34%, and 39% decreased risk of all-cause mortality, CVD-related mortality, and CVD-related hospitalization or myocardial infarction, respectively [35]. In a subgroup analysis, including multidrug therapy with these cardiovascular medications, non-adherence was associated with a 43% higher risk of all-cause mortality.
- Although no gold standard for measuring adherence to multidrug therapy is currently available, DPPR is the most recent and theoretically the optimal measurement of adherence to multidrug therapy [36]. This method accounts for the specificity of multidrug therapy, including the number of concurrent medications used and the frequency of switching medications. The measurement of DPPR is based on daily supply information by determining how many medications are available and weighting a score by the number of medications to be taken each day. Despite its sensitive and intricate method, however, the DPPR has not been widely used. The calculations to generate estimates can be complicated, both manually and when aided by a computer, especially in long-term follow-up. This study found that the PDCwith≥1 showed similar results to the DPPR. Thus, the more traditional and simplest method, the PDCwith≥1, might be an alternative option to the more current and complex method, the DPPR, when measuring adherence to antihypertensive multidrug therapy.
- This study had several strengths. First, we demonstrated standardized ways of comparing and validating different measurements and approaches when assessing adherence to multidrug antihypertensive therapy in patients with hypertension. Second, this study affirmed the robustness of a higher risk for primary clinical outcomes by comparing non-adherence to adherence across the different adherence measurements.
- Our study also had limitations. First, the use of a claims database, which collects data for reimbursement and not for research purposes, limited our ability to validate whether patients actually took their medications as prescribed. However, our findings may help identify a reasonable range of medication adherence and the related clinical outcome risks according to how the adherence is measured. Second, as this study focused on measuring adherence to individual classes of antihypertensive medications, we were unable to compare fixed-dose combination pills to single-medication pills. Because adherence to medication is a complex phenomenon that requires comprehensive assessment, the current study needs to be expanded further. Third, due to the unique characteristics of the Korean NHIS, which is a unified nationwide single payer, we were able to conduct uninterrupted follow-up of the participants and measure their adherence to the chronic use of multidrug antihypertensive therapy. In addition, the Korean NHIS provides a relatively stable health system, which might influence medication adherence. Further studies in different health systems are necessary to validate our findings. Lastly, adherence might vary according to different types of medications and their regimens. Additional research is warranted to study adherence to other medications that are commonly used in chronic and multidrug therapy such as antidiabetic drugs.
- In conclusion, the associations between non-adherence to multidrug antihypertensive therapy and the higher risk of primary clinical outcomes were largely consistent when applying the PDCwith≥1, PDCwm, and DPPR measurements across 2 approaches to defining the study’s end-date (FxM and PxM). This study proposes the potential utilization of PDCwith≥1 as a broad, practical, and reliable method, instead of other more complicated measurement options, in patients with hypertension.
DISCUSSION
SUPPLEMENTARY MATERIALS
Supplementary Material 1.
Supplementary Material 2
Supplementary Material 3
Supplementary Material 4
Supplementary Material 5
Supplementary Material 6
Supplementary Material 7
Supplementary Material 8
Supplementary Material 9
-
CONFLICT OF INTEREST
The authors have no conflicts of interest to declare for this study.
-
FUNDING
This research was supported by a grant (21153MFDS602) from the Ministry of Food and Drug Safety.
-
AUTHOR CONTRIBUTIONS
Conceptualization: Jung M, Choo E, Lee S. Data curation: Choo E. Formal analysis: Choo E. Funding acquisition: Lee S. Methodology: Jung M, Choo E, Lee S. Project administration: Lee S. Visualization: Lee S. Writing – original draft: Jung M. Writing – review & editing: Jung M, Choo E, Lee S.
NOTES
ACKNOWLEDGEMENTS

Values are presented as number (%) or hazard ratio (95% confidence interval).
CVD, cardio-cerebrovascular disease; PxM, prescription-based methodology; PDCwith≥1, proportion of days covered with at least one drug; PDCwm, duration weighted mean PDC; DPPR, daily polypharmacy possession ratio; FxM, fixed period-based methodology.
AIC, Akaike information criterion; CI, confidence interval; CVD, cardio-cerebrovascular disease; PxM, prescription-based methodology; PDCwith≥1, proportion of days covered with at least one drug; PDCwm, duration weighted mean PDC; DPPR, daily polypharmacy possession ratio; FxM, fixed period-based methodology.
- 1. Osterberg L, Blaschke T. Adherence to medication. N Engl J Med 2005;353:487-497.ArticlePubMed
- 2. van Staa TP, Abenhaim L, Leufkens H. A study of the effects of exposure misclassification due to the time-window design in pharmacoepidemiologic studies. J Clin Epidemiol 1994;47:183-189.ArticlePubMed
- 3. Steiner JF, Prochazka AV. The assessment of refill compliance using pharmacy records: methods, validity, and applications. J Clin Epidemiol 1997;50:105-116.ArticlePubMed
- 4. Blais L, Vilain A, Kettani FZ, Forget A, Lalonde G, Beauchesne MF, et al. Accuracy of the days’ supply and the number of refills allowed recorded in Québec prescription claims databases for inhaled corticosteroids. BMJ Open 2014;4:e005903.ArticlePubMedPMC
- 5. Coronary Drug Project Research Group. Influence of adherence to treatment and response of cholesterol on mortality in the coronary drug project. N Engl J Med 1980;303:1038-1041.ArticlePubMed
- 6. LaRosa JC. Poor compliance: the hidden risk factor. Curr Atheroscler Rep 2000;2:1-4.ArticlePubMedPDF
- 7. Horwitz RI, Horwitz SM. Adherence to treatment and health outcomes. Arch Intern Med 1993;153:1863-1868.ArticlePubMed
- 8. Senst BL, Achusim LE, Genest RP, Cosentino LA, Ford CC, Little JA, et al. Practical approach to determining costs and frequency of adverse drug events in a health care network. Am J Health Syst Pharm 2001;58:1126-1132.ArticlePubMed
- 9. McDonnell PJ, Jacobs MR. Hospital admissions resulting from preventable adverse drug reactions. Ann Pharmacother 2002;36:1331-1336.ArticlePubMedPDF
- 10. Zhou B, Perel P, Mensah GA, Ezzati M. Global epidemiology, health burden and effective interventions for elevated blood pressure and hypertension. Nat Rev Cardiol 2021;18:785-802.ArticlePubMedPMCPDF
- 11. Kim HC, Cho SM, Lee H, Lee HH, Baek J, Heo JE, et al. Korea hypertension fact sheet 2020: analysis of nationwide populationbased data. Clin Hypertens 2021;27:8.ArticlePubMedPMCPDF
- 12. Gossec L, Tubach F, Dougados M, Ravaud P. Reporting of adherence to medication in recent randomized controlled trials of 6 chronic diseases: a systematic literature review. Am J Med Sci 2007;334:248-254.ArticlePubMed
- 13. Burnier M. Drug adherence in hypertension. Pharmacol Res 2017;125:142-149.ArticlePubMed
- 14. Hill MN, Miller NH, Degeest S; American Society of Hypertension Writing Group, Materson BJ, Black HR, et al. Adherence and persistence with taking medication to control high blood pressure. J Am Soc Hypertens 2011;5:56-63.ArticlePubMed
- 15. Touyz RM. Hypertension 2022 update: focusing on the future. Hypertension 2022;79:1559-1562.ArticlePubMed
- 16. Nau DP. Proportion of days covered (PDC) as a preferred method of measuring medication adherence. Springfield: Pharmacy Quality Alliance;; 2012. p. 1-3.
- 17. Pednekar PP, Ágh T, Malmenäs M, Raval AD, Bennett BM, Borah BJ, et al. Methods for measuring multiple medication adherence: a systematic review-report of the ISPOR medication adherence and persistence special interest group. Value Health 2019;22:139-156.ArticlePubMed
- 18. Quisel T, Foschini L, Zbikowski SM, Juusola JL. The association between medication adherence for chronic conditions and digital health activity tracking: retrospective analysis. J Med Internet Res 2019;21:e11486.ArticlePubMedPMC
- 19. Hedna K, Hakkarainen KM, Gyllensten H, Jönsson AK, Andersson Sundell K, Petzold M, et al. Adherence to antihypertensive therapy and elevated blood pressure: should we consider the use of multiple medications? PLoS One 2015;10:e0137451.ArticlePubMedPMC
- 20. Zongo A, Grégoire JP, Moisan J, Guénette L. Measuring adherence to oral antidiabetic multi-drug treatment: comparative validity of prescription claims-based adherence measures against hospitalization. Res Social Adm Pharm 2019;15:738-743.ArticlePubMed
- 21. Bjarnadottir MV, Czerwinski D, Onukwugha E. Sensitivity of the medication possession ratio to modelling decisions in large claims databases. Pharmacoeconomics 2018;36:369-380.ArticlePubMedPDF
- 22. Choo E, Jung M, Shin J, Lee S. Comparing the sensitivities of measures of adherence to antihypertensive drugs using Korean National Health Insurance Claims Data. Patient Prefer Adherence 2021;15:1717-1728.ArticlePubMedPMCPDF
- 23. Kwon S. Payment system reform for health care providers in Korea. Health Policy Plan 2003;18:84-92.ArticlePubMed
- 24. Lee J, Lee JS, Park SH, Shin SA, Kim K. Cohort profile: the National Health Insurance Service-National Sample Cohort (NHISNSC), South Korea. Int J Epidemiol 2017;46:e15.ArticlePubMed
- 25. Choudhry NK, Shrank WH, Levin RL, Lee JL, Jan SA, Brookhart MA, et al. Measuring concurrent adherence to multiple related medications. Am J Manag Care 2009;15:457-464.PubMedPMC
- 26. Bansilal S, Castellano JM, Garrido E, Wei HG, Freeman A, Spettell C, et al. Assessing the impact of medication adherence on long-term cardiovascular outcomes. J Am Coll Cardiol 2016;68:789-801.ArticlePubMed
- 27. Pittman DG, Tao Z, Chen W, Stettin GD. Antihypertensive medication adherence and subsequent healthcare utilization and costs. Am J Manag Care 2010;16:568-576.PubMed
- 28. Slejko JF, Ho M, Anderson HD, Nair KV, Sullivan PW, Campbell JD. Adherence to statins in primary prevention: yearly adherence changes and outcomes. J Manag Care Pharm 2014;20:51-57.ArticlePubMed
- 29. Quan H, Li B, Couris CM, Fushimi K, Graham P, Hider P, et al. Updating and validating the Charlson comorbidity index and score for risk adjustment in hospital discharge abstracts using data from 6 countries. Am J Epidemiol 2011;173:676-682.ArticlePubMed
- 30. Seong SC, Kim YY, Park SK, Khang YH, Kim HC, Park JH, et al. Cohort profile: the National Health Insurance Service-National Health Screening Cohort (NHIS-HEALS) in Korea. BMJ Open 2017;7:e016640.ArticlePubMedPMC
- 31. Kimm H, Yun JE, Lee SH, Jang Y, Jee SH. Validity of the diagnosis of acute myocardial infarction in Korean National Medical Health Insurance Claims Data: the Korean Heart Study (1). Korean Circ J 2012;42:10-15.ArticlePubMedPMC
- 32. Won TY, Kang BS, Im TH, Choi HJ. The study of accuracy of death statistics. J Korean Soc Emerg Med 2007;18:256-262 (Korean).
- 33. Zongo A, Grégoire JP, Moisan J, Guénette L. Measuring adherence to oral antidiabetic multi-drug treatment: comparative validity of prescription claims-based adherence measures against hospitalization. Res Social Adm Pharm 2019;15:738-743.ArticlePubMed
- 34. Kozma CM, Dickson M, Phillips AL, Meletiche DM. Medication possession ratio: implications of using fixed and variable observation periods in assessing adherence with disease-modifying drugs in patients with multiple sclerosis. Patient Prefer Adherence 2013;7:509-516.ArticlePubMedPMC
- 35. Du L, Cheng Z, Zhang Y, Li Y, Mei D. The impact of medication adherence on clinical outcomes of coronary artery disease: a meta-analysis. Eur J Prev Cardiol 2017;24:962-970.ArticlePubMedPDF
- 36. Arnet I, Greenland M, Knuiman MW, Rankin JM, Hung J, Nedkoff L, et al. Operationalization and validation of a novel method to calculate adherence to polypharmacy with refill data from the Australian pharmaceutical benefits scheme (PBS) database. Clin Epidemiol 2018;10:1181-1194.ArticlePubMedPMCPDF
 PubReader
 ePub Link
 Cite
Cite


