
Articles
- Page Path
- HOME > Epidemiol Health > Volume 45; 2023 > Article
-
Cohort Profile
Integrated database-based Screening Cohort for Asian Nomadic descendants in China (Scan-China): Insights on prospective ethnicity-focused cancer screening -
Yuelin Yu1*
 , Liying Qiao2*, Jing Han2, Weiwei Wang1, Weiwei Kang2, Yunjing Zhang1, Shu Shang2, Ruogu Meng3, Lin Zhuo4, Siyan Zhan1, Yunfeng Xi2, Shengfeng Wang1
 -
Epidemiol Health 2023;45:e2023048.
DOI: https://doi.org/10.4178/epih.e2023048
Published online: April 18, 2023
1Department of Epidemiology and Biostatistics, School of Public Health, Peking University, Beijing, China
2Center for Disease Control and Prevention in Inner Mongolia, Hohhot, China
3National Institute of Health Data Science, Peking University, Beijing, China
4Research Center of Clinical Epidemiology, Peking University Third Hospital, Beijing, China
- Correspondence: Shengfeng Wang Department of Epidemiology and Biostatistics, School of Public Health, Peking University, 38 Xueyuan Road, Haidian District, Beijing 100191, China E-mail: shengfeng1984@126.com
- Co-correspondence: Yunfeng Xi Center for Disease Control and Prevention in Inner Mongolia, Hohhot 010000, China E-mail: xiyunfeng210@163.com
- *Yu & Qiao contributed equally to this work as joint first authors
© 2023, Korean Society of Epidemiology
This is an open-access article distributed under the terms of the Creative Commons Attribution License (http://creativecommons.org/licenses/by/4.0/), which permits unrestricted use, distribution, and reproduction in any medium, provided the original work is properly cited.
- 2,995 Views
- 75 Download
Abstract
- Established in 2017, the Screening Cohort for Asian Nomadic descendants in China (Scan-China) has benefited over 180,000 members of a multi-ethnic population, particularly individuals of Mongolian descent compared with the general population (Han ethnicity), in the Inner Mongolia Autonomous Region, China. This cohort study aims to evaluate the effectiveness of cancer screening and serve as a real-world data platform for cancer studies. The 6 most prevalent cancers in China are considered—namely, breast, lung, colorectal, gastric, liver and esophageal cancer. After baseline cancer risk assessments and screening tests, both active and passive follow-up (based on the healthcare insurance database, cancer registry, the front page of hospital medical records, and death certificates) will be conducted to trace participants’ onset and progression of cancers and other prevalent chronic diseases. Scan-China has preliminarily found a disproportionately lower screening participation rate and higher incidence/mortality rates of esophageal and breast cancer among the Mongolian population than among their Han counterparts. Further research will explore the cancer burden, natural history, treatment patterns, and risk factors of the target cancers.
- Most screening programs are one-size-fits-all, despite their high efficiency in identifying high-risk and early-onset populations and cost-effectiveness in reducing cancer incidence and mortality [1-3]. Racial/ethnic minorities worldwide, compared to the general populations, are reported to have lower and less timely uptake and completion of screening [4-10], along with a higher risk of cancer health disparities due to genetic, geographic, and socioeconomic factors [11-13]. In Western countries, Asian minorities have among the severest patterns of these alarming disparities [6]. However, this issue has been persistently overlooked on the multicultural Asian continent.
- Mongolians, who descend from Asian nomads inhabiting grassland areas, are among the largest ethnic minorities in East Asia (over 10 million population worldwide, including 6.3 million Chinese residents). Mongolians’ traditional dietary habits are characterized by highly caloric, salty food and high consumption of red meat and dairy products to accommodate their migratory patterns [14]. Although they currently live mixed with the general population (Han ethnicity) in China, Mongolians’ distinctive living patterns, together with genetic factors conferring susceptibility [15,16] and cultural beliefs [17] inherited from their ancestors, may contribute to pessimistic uptake and poor effectiveness of screening. However, Mongolian-oriented screening programs have not been initiated, and studies have not focused on cancer disparities between Mongolians and the general population in China. These gaps have led to cancer health disparities being persistently unaddressed.
- The Screening Cohort for Asian Nomadic descents in China Inner Mongolia Autonomous Region (Scan-China) project is the first and largest screening program tailored for the Mongolian ethnicity, initiated in the Inner Mongolia Autonomous Region of China. Inner Mongolia is the area with the largest population of the Mongolian ethnicity globally, wherein Mongolians constitute the second-largest ethnicity (19.3% of the total population) [18]. Derived from the Cancer Screening Program in Urban China (detailed information can be seen in previous relative literature [19,20] and in the Supplementary Material 1), Scan-China offers cancer risk assessments and screening tests for the 6 most prevalent cancers in urban areas (lung, breast, liver, esophageal, gastric and colorectal). Scan-China aims to evaluate the effectiveness of screening, particularly for ethnic minorities, to describe the natural history and explore risk factors of the targeted cancer types and prevalent comorbidities, and to portray treatment patterns among different ethnicities, all contributing to addressing cancer health disparities across ethnicities.
- Scan-China targets urban residents in 5 districts of 2 major cities (Xincheng District, Huimin District, Yuquan District, and Saihan District in the city of Hohhot; Keerqin District in the city of Tongliao) with the largest population (over 1 million per city) in Inner Mongolia (Figure 1). The districts were selected based on population size, representativeness of multiple ethnicities (Han, Mongolian, and other ethnic minorities living mixed together), and the feasibility of project implementation considering healthcare resources and hospital collaborations. In detail, Hohhot is the provincial capital and Tongliao is one of the birthplaces of the Mongolian ethnicity, respectively representing developed (top-level gross domestic product) and developing (medium-level gross domestic product) levels of healthcare resources in Inner Mongolia [18].
INTRODUCTION
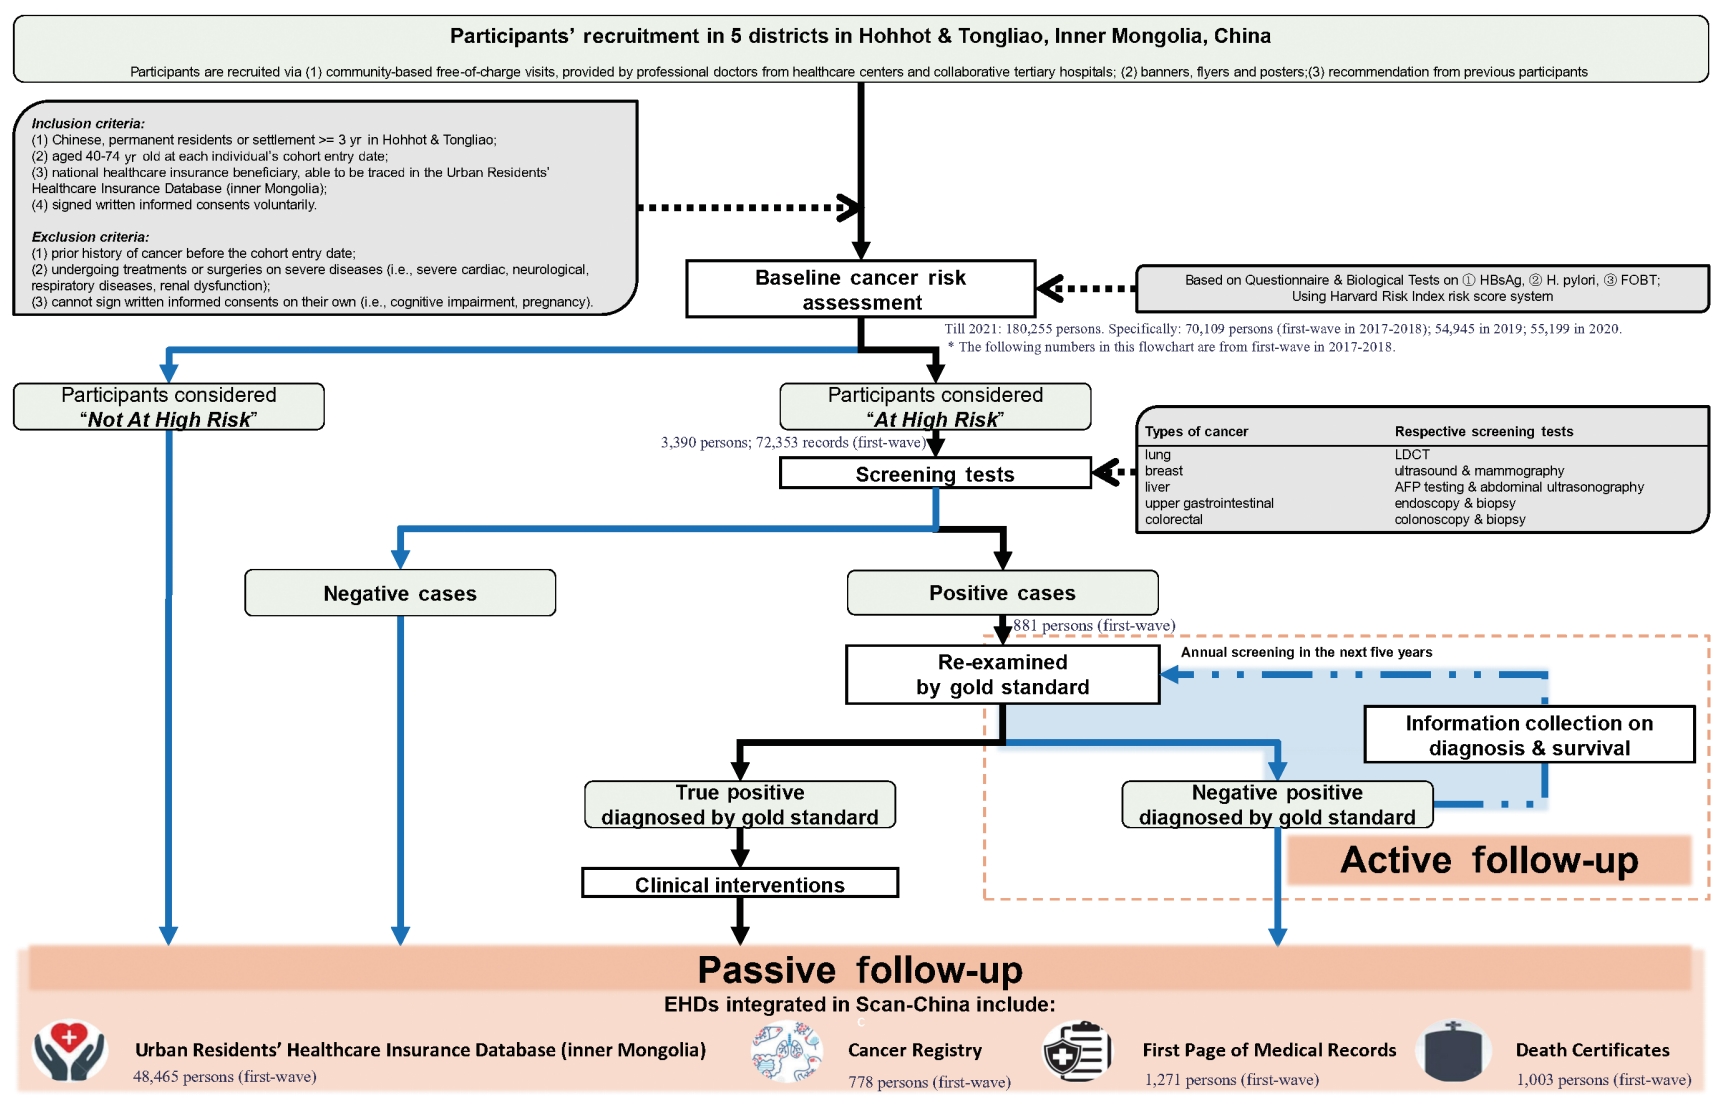
- This dynamic cohort was planned to benefit 30,000 new participants annually. Participants who meet the following inclusion criteria would be recruited in Scan-China after a baseline cancer risk assessment: (1) Chinese residents of the catchment areas, or with a minimum residence of 3 years in Hohhot or Tongliao, (2) aged 40-74 years old at the cohort entry date, (3) being a community-dwelling national healthcare insurance beneficiary, (4) having voluntarily signed a written informed consent form to participate in Scan-China. Individuals of all ethnicities have equal rights and chances to participate in Scan-China. Eligible individuals are voluntarily enrolled and not restricted by ethnicity. More detailed inclusion and exclusion criteria are shown in the Supplementary Material 1 and Figure 2.
- Follow-up is conducted both actively and passively. All participants in Scan-China will be passively followed via annual linkage of the baseline results of risk assessment and screening tests to multi-source electronic health data (EHD) databases in Inner Mongolia. The EHD databases of Scan-China include the Urban Residents’ Healthcare Insurance Database (URHID), the Cancer Registry (CaR), the front page of hospital medical records (FPMR), and death certificates (DCs), all officially governed by the Inner Mongolia Center for Disease Control and Prevention.
- Data linkage and integration are conducted using personal identity numbers, which are de-identified during data analysis for privacy protection. Standardized coding systems are used across the EHD databases of Scan-China. The diagnoses of diseases and causes of death are coded using the International Classification of Diseases, 10th revision (ICD-10). The prescriptions in URHID are coded using the Anatomical Therapeutic Chemical (ATC) system. Moreover, specific validation of the accuracy of EHD-sourced diagnoses has been conducted independently by 2 clinical experts, who checked the diagnoses of a certain portion of random samples from the whole cohort population (an initial assessment found about 94% accuracy in the diagnoses of cardiovascular diseases).
- The active follow-up is tailored for participants who receive positive screening results for any cancer via phone calls or in-house visits, as well as medical records for subsequent confirmation of their status of cancer onset. Clinical experts from collaborative tertiary hospitals will conduct gold-standard examinations to diagnose cancer. Participants who receive positive screening results but negative examination findings will undergo annual re-screening for the next 5 years. Participants with confirmed diagnoses of cancer will be recommended to visit doctors for professional treatment.
- Ethics statement
- The project was approved by the Institutional Review Board (IRB) of Ethics Committee of Inner Mongolia Autonomous Region Center for Disease Control and Prevention (IRB No. NMCDCIRB2021001). Informed consent was confirmed by the IRB. The project has been submitted for registration in the China Clinical Trial Registration Center. The recruited participants all signed written informed consent at baseline. The authors affirm that the human research participants provided informed consent for the publication of all results involved in this paper.
STUDY PARTICIPANTS
- Information throughout the screening is collected via a baseline questionnaire and biological tests for cancer risk assessment, screening tests and blood samples if necessary, and active and passive follow-up via EHD databases. A detailed statistical analysis plan for the analyses that will be conducted and what will be reported when the follow-up period is extended to 10 years or 20 years can be seen in the Supplementary Material 1. Cancer-related information is mainly collected during follow-up, involving diagnoses, treatments, and details on cancer onset and survival status (Table 1).
- Baseline cancer risk assessment: questionnaire survey for all participants
- All eligible participants are required to engage in cancer risk assessments via a paper-based questionnaire with instructions from trained staff (Table 1). The assessment is based on the Harvard Risk Index [21-23]. For each participant, the information collected at baseline includes socio-demographic characteristics, behaviors and environmental/occupational exposures to cancer-related risk factors, psychological conditions, and personal and family history of diseases. Details on lifestyle habits such as food preferences regarding temperature and flavor are also collected, filling an insufficiency in most previous screening cohorts.
- Baseline screening and blood sample collection: biochemical tests for the high-risk population
- Only high-risk participants according to the baseline assessment are recommended to receive screening tests for the respective targeted cancers. All screening tests are provided by collaborating hospitals, free of charge, and are conducted by physicians with over 5 years of clinical experience. Meanwhile, an expert panel from the National Cancer Center of China has been assembled as the third party to provide consultation if physicians are unsure of reaching a positive or negative classification. For participants at high-risk for liver cancer, upper gastrointestinal cancer, and colorectal cancer, a 5-mL blood sample per person is collected prior to the above screening tests. Each participant’s screening test results and details on pathology reports are archived both physically and electronically in the screening database [22,24].
- Electronic health data-integrated follow-up strategy: annual dynamic updates for all participants
- A detailed description of the core variables available in Scan-China databases is shown in Table 1 and Supplementary Material 2. In brief, information on disease diagnoses, prescriptions, hospitalizations, and medical expenses throughout an individual’s entire course of hospital visits will be available in the URHID. The FPMR offers details related to clinical diagnoses and in-hospital treatments, while the CaR concentrates on tumor-related information, including cancer onset, clinical status, and pathological findings. The survival status, causes of death, and date of death will be monitored using DCs. The passive follow-up will be annually conducted to dynamically update each participant’s health condition.
MEASUREMENTS
- Scan-China was established on January 1, 2017 and residents could enter the cohort dynamically. By December 31, 2021, Scan-China has benefited 180,255 people (about 11% Mongolian) in Inner Mongolia (70,109 at the first-wave baseline completed by December 31, 2018), with an average increase of 4,500 new participants annually. For 48,471, 792, and 1,004 participants, disease onset and ongoing disease status were reported in the URHID (over 2.3 million records on diagnoses of the Scan-China participants were captured from January 1, 2017 to December 31, 2021), CaR, and DC, respectively.
- After baseline questionnaire validation, successful linkage across EHDs, and data cleaning, 68,349 Han and Mongolian participants at the first-wave baseline were included in the analysis, with median (interquartile, IQR) age of 55.12 years (IQR, 47.82 to 62.93; 52.7% female, 11.7% Mongolian). Compared with the Han population, the Mongolian population showed significantly larger proportions of consumption of red meat (38.5 vs. 30.8%); hot (26.6 vs. 20.9%), salty (32.1 vs. 23.3%) and high-oil (30.7 vs. 23.4%) foods; and alcohol (28.5 vs. 21.5%) (p< 0.001 for all) (Table 2). The Mongolian population had a higher prevalence of chronic diseases (30.0 vs. 23.8% for chronic respiratory diseases, 26.10 vs. 19.03% for upper gastrointestinal diseases, 17.3 vs. 12.9% for lower gastrointestinal diseases, 32.3 vs. 25.0% for hepatobiliary diseases; p< 0.05 for all) and higher risky in all types of cancer (over 20 vs. less than 20%, p< 0.001 for all).
- Differences in cancer incidence according to sex and ethnicity were specifically described (Table 3). The highest overall 3-year cumulative incidence was of breast cancer (4.28 per 1,000 persons; 95% confidence interval [CI], 3.61 to 4.94), followed by lung cancer (3.47; 95% CI, 3.03 to 3.91), colorectal cancer (2.87; 95% CI, 2.47 to 3.27), gastric cancer (1.52; 95% CI, 1.23 to 1.81), liver cancer (1.14; 95% CI, 0.89 to 1.39) and esophageal cancer (0.66; 95% CI, 0.47 to 0.85). Compared with the Han population, Mongolians showed a higher incidence of esophageal cancer (2.26; 95% CI, 0.59 to 3.93 vs. 1.16; 95% CI, 0.76 to 1.55 in male; 0.21; 95% CI, 0.00 to 0.61 vs. 0.13; 95% CI, 0.00 to 0.25 in female) and breast cancer (4.73; 95% CI, 2.80 to 6.65 vs. 4.21; 95% CI, 3.50 to 4.92). The top 3 cancers in terms of mortality were lung cancer (1.23; 95% CI, 0.97 to 1.49), liver cancer (0.82; 95% CI, 0.60 to 1.03) and gastric cancer (0.45; 95% CI, 0.29 to 0.61). Among all targeted cancer types, male Mongolians showed higher mortality from esophageal cancer (1.29; 95% CI, 0.03 to 2.55 vs. 0.53; 95% CI, 0.26 to 0.79).
KEY FINDINGS
- Scan-China is the first EHD-integrated dynamic screening cohort targeting multiple ethnicities in Inner Mongolia. With the aim of addressing poor screening effectiveness among ethnic minorities, Scan-China is a unique platform for popularizing applicable health interventions for the Mongolian minority.
- Cancer cohorts integrated with EHD databases show greater cost-effectiveness and time-effectiveness [25-27]. The current findings from Scan-China demonstrated accurate linkage across the baseline population and respective EHD databases. In particular, the capture rate of passive follow-up through the claims database reached 92.2%, which is better than the extant high-quality passive EHD follow-up [28], indicating the feasibility and high efficiency of the EHD-integrated follow-up strategy. Although data quality remains a stubborn challenge for almost all real-world studies [29,30], the multi-source EHD databases enable Scan-China to achieve information validation, timestamp selection, and progression tracking of diseases. More importantly, Scan-China sets a framework for the linkage and integration of heterogeneous EHD databases in the scope of a cancer screening cohort, advancing beyond the CHERRY study [31], which utilized inherently linked EHD on cardiovascular diseases.
- Another distinctive merit of Scan-China is that it presents information on comorbidities, complications, and treatment patterns among Mongolian patients. It should be mentioned that traditional Mongolian medicine accounts for a majority of treatment strategies among this population, in parallel with Western medicine and traditional Chinese medicine. Scan-China will shed light on cancer-related treatment priorities regarding drug effectiveness and safety. For example, cardiovascular complications have been increasingly reported as a major drug adverse reaction during chemotherapy [32]. Differences in treatment patterns among the Mongolian ethnicity, in comparison with the general population, might provide insights into how to ameliorate disparities in the prognosis of cancer and other prevalent cardiovascular diseases.
- Nonetheless, the project has some limitations. First, Scan-China only targets urban residents and lacks representativeness of the rural population in consideration of study feasibility. Furthermore, the baseline questionnaire was only answered by participants who volunteered to take part in the study. This might have generated selection bias. Second, the baseline information on cancer-related risk factors (such as lifestyle habits) was all self-reported, which induced unavoidable recall bias. Third, the inclusion criteria in terms of the age range might have caused information loss on early-life exposures. Third, overdiagnosis, overtreatment, and misinterpretation of clinical data may have taken place [33]. However, all the aforementioned limitations are inherent to most screening cohorts’ design and cannot be avoided [34]. Moreover, problems with EHD quality are inherently unavoidable. Previous studies have reported that cancer incidence has been underestimated [35,36]. However, combining multi-source EHD databases might complement the completeness and reliability of records. Furthermore, the 3-year cumulative cancer incidence from Scan-China showed smaller differences between males and females than reported in the previous literature [37,38]. This may have been partly because the denominator used for incidence calculation was only composed of the first-wave population at the current preliminary stage. Alternatively, the larger differences could be explained by the inclusion of all cancer patients in other studies, rather than high-risk groups in the age range of 40-74 years or participants in cancer screening programs. Therefore, the findings from Scan-China need to be cautiously generalized in the context of comparable screening programs, population proportions, and data sources.
STRENGTHS AND WEAKNESSES
- Scan-China is not an open-access database. The data utilized in its future studies will be available in de-identified form upon reasonable request, with approval from the expert panel of Scan-China, the Inner Mongolia Autonomous Region Center for Disease Control and Prevention, and the Ethics Committee of National Cancer Center/Cancer Hospital, China Academy of Medical Sciences and Peking Union Medical College. Collaborations and external investigations of the Scan-China dataset are welcomed to make further contributions to cancer health promotion. The expert panel of Scan-China will contact you via e-mail if your application is considered meaningful (with application materials including the study protocol, statistical analysis plan, and contribution statement) and data use is approved by the above committees.
DATA ACCESSIBILITY
SUPPLEMENTARY MATERIALS
-
CONFLICT OF INTEREST
The authors have no conflicts of interest to declare for this study
-
FUNDING
The project is supported by the Natural Science Foundation of Inner Mongolia Autonomous Region, China (2021MS08039).
-
AUTHOR CONTRIBUTIONS
Conceptualization: Yu Y, Xi Y, Wang S. Data curation: Yu Y, Qiao L, Kang W, Shang S. Formal analysis: Yu Y, Han J, Wang W. Funding acquisition: Zhan S, Xi Y, Wang S. Methodology: Yu Y, Qiao L, Xi Y, Wang S. Project administration: Qiao L, Han J, Kang W, Zhang Y, Shang S, Xi Y. Visualization: Yu Y. Writing – original draft: Yu Y, Xi Y, Wang S. Writing – review & editing: Yu Y, Qiao L, Han J, Wang W, Kang W, Zhang Y, Shang S, Meng R, Zhuo L, Zhan S, Xi Y, Wang S.
NOTES
ACKNOWLEDGEMENTS

| Characteristics | Han ethnicity | Mongolian ethnicity | p-value | ||
|---|---|---|---|---|---|
| No. of participants at first-wave baseline | 60,380 (88.3) | 7,969 (11.7) | |||
| Age at first wave, mean±SD (yr) | 55.77±9.07 | 54.19±8.53 | <0.001 | ||
| Sex | <0.001 | ||||
| Male | 28,529 (47.2) | 3,103 (38.9) | |||
| Female | 31,851 (52.7) | 4,866 (61.1) | |||
| Education | <0.001 | ||||
| Junior high school or lower | 32,839 (54.4) | 3,368 (42.3) | |||
| Senior high school or higher | 27,541 (45.6) | 4,601 (57.7) | |||
| Martial status | <0.001 | ||||
| Currently single | 1,653 (2.7) | 282 (3.5) | |||
| Currently married | 58,727 (97.3) | 7,687 (96.5) | |||
| Equipped with household heating | <0.001 | ||||
| Yes | 58,720 (97.2) | 7,874 (98.8) | |||
| No | 1,660 (2.7) | 95 (1.2) | |||
| Type of household heating fuels | <0.001 | ||||
| Cleaner fuels | 55,158 (93.9) | 7,083 (89.9) | |||
| Coal | 3,532 (6.0) | 784 (10.0) | |||
| Others | 30 (0.0) | 7 (0.1) | |||
| Type of household cooking fuels | <0.001 | ||||
| Cleaner fuels | 58,482 (96.9) | 7,632 (95.8) | |||
| Coal | 1,734 (2.9) | 310 (3.9) | |||
| Others | 164 (0.3) | 27 (0.3) | |||
| Dietary habits2,3 | |||||
| Average consumption (/wk) of fresh vegetables | <0.001 | ||||
| Never | 3,179 (5.3) | 268 (3.4) | |||
| Not much | 41,600 (68.9) | 5,348 (67.1) | |||
| Meet the recommended amount | 15,601 (25.8) | 2,353 (29.5) | |||
| Average consumption (/wk) of fresh fruits | <0.001 | ||||
| Never | 3,873 (6.4) | 444 (5.6) | |||
| Not much | 42,466 (70.3) | 5,385 (67.6) | |||
| Meet the recommended amount | 14,041 (23.2) | 2,140 (26.8) | |||
| Average consumption (/wk) of red meat | <0.001 | ||||
| Never | 2,521 (4.2) | 191 (2.4) | |||
| Not much | 39,260 (65.0) | 4,709 (59.1) | |||
| Meet the recommended amount | 18,599 (30.8) | 3,069 (38.5) | |||
| Average consumption (/wk) of coarse grains | <0.001 | ||||
| Never | 5,108 (8.5) | 817 (10.2) | |||
| Not much | 41,799 (69.2) | 5,288 (66.4) | |||
| Meet the recommended amount | 13,473 (22.3) | 1,864 (23.4) | |||
| Preference for food temperature | <0.001 | ||||
| Hot | 12,594 (20.9) | 2,123 (26.6) | |||
| Moderate | 46,105 (76.4) | 5,624 (70.6) | |||
| Cold | 1,681 (2.8) | 222 (2.8) | |||
| Preference for food flavor | <0.001 | ||||
| Salty | 14,053 (23.3) | 2,561 (32.1) | |||
| Moderate | 41,927 (69.4) | 4,686 (58.8) | |||
| Plain (light seasoning) | 4,400 (7.3) | 722 (9.1) | |||
| Preference for fat and oil content | <0.001 | ||||
| High | 14,147 (23.4) | 2,450 (30.7) | |||
| Moderate | 42,282 (70.0) | 4,836 (60.7) | |||
| Little | 3,951 (6.5) | 683 (8.6) | |||
| Smoking status | <0.001 | ||||
| Never | 46,071 (76.3) | 5,696 (71.5) | |||
| Ex-smoker | 1,554 (2.6) | 272 (3.4) | |||
| Current smoker | 12,755 (21.1) | 2,001 (25.1) | |||
| Alcohol consumption | <0.001 | ||||
| Never | 46,324 (76.7) | 5,481 (68.8) | |||
| Ex-drinker | 1,087 (1.8) | 220 (2.8) | |||
| Current drinker | 12,969 (21.5) | 2,268 (28.5) | |||
| Tea consumption | <0.001 | ||||
| Never | 40,071 (66.4) | 4,472 (56.1) | |||
| Not often | 1,525 (2.5) | 278 (3.5) | |||
| Regular | 18,784 (31.1) | 3,219 (40.4) | |||
| Having regular physical exercises | 22,605 (37.4) | 3,070 (38.5) | 0.061 | ||
| Body mass index, mean±SD (kg/m2) | 24.02±2.79 | 24.54±3.13 | <0.001 | ||
| Self-reported prevalence of chronic diseases | |||||
| Chronic respiratory diseases | 14,345 (23.8) | 2,389 (30.0) | <0.001 | ||
| Tuberculosis | 1,781 (12.4) | 319 (13.4) | 0.205 | ||
| Chronic bronchitis | 12,734 (88.8) | 2,136 (89.4) | 0.380 | ||
| Emphysema | 3,549 (24.7) | 243 (10.2) | <0.001 | ||
| Asthma | 5,503 (38.4) | 769 (32.2) | <0.001 | ||
| Upper gastrointestinal diseases | 11,491 (19.0) | 2,080 (26.1) | <0.001 | ||
| Gastroesophageal reflux | 2,972 (25.9) | 586 (28.2) | 0.028 | ||
| Superficial gastritis | 9,365 (81.5) | 1,746 (84.0) | 0.007 | ||
| Atrophic gastritis | 2,795 (24.3) | 380 (18.3) | <0.001 | ||
| Gastric ulcers | 4,629 (40.3) | 831 (40.0) | 0.808 | ||
| Duodenal ulcers | 2,322 (20.2) | 370 (17.8) | 0.011 | ||
| Gastric polyposis | 1,916 (16.7) | 258 (12.4) | <0.001 | ||
| Lower gastrointestinal diseases | 7,787 (12.9) | 1,379 (17.3) | <0.001 | ||
| Intestinal polyposis | 2,796 (37.6) | 392 (30.6) | <0.001 | ||
| Ulcerative colitis and Crohn's disease | 6,470 (87.0) | 1,152 (89.9) | 0.004 | ||
| Hepatobiliary diseases | 14,980 (25.0) | 2,537 (32.3) | <0.001 | ||
| Fatty liver | 13,589 (89.6) | 2,316 (88.3) | 0.046 | ||
| Gallstone | 6,857 (45.2) | 1,264 (48.1) | 0.006 | ||
| Chronic hepatitis B | 1,086 (7.2) | 211 (8.1) | 0.095 | ||
| Chronic hepatitis C | 788 (5.2) | 130 (5.0) | 0.702 | ||
| Liver cirrhosis | 3,085 (20.4) | 224 (8.6) | <0.001 | ||
| Cardiovascular and metabolic diseases | |||||
| Hypertension | 7,991 (67.9) | 1,722 (69.4) | 0.142 | ||
| Diabetes mellitus | 2,465 (20.9) | 511 (20.6) | 0.724 | ||
| Hyperlipidemia | 6,484 (55.1) | 1,601 (64.5) | <0.001 | ||
| Family history of diseases | 10,476 (17.3) | 2,211 (27.7) | <0.001 | ||
| Lung cancer | 5,334 (48.7) | 1,123 (48.4) | 0.766 | ||
| Esophageal cancer | 1,608 (14.7) | 399 (17.2) | 0.003 | ||
| Gastric cancer | 2,681 (24.5) | 534 (23.0) | 0.129 | ||
| Liver cancer | 4,718 (43.2) | 874 (37.7) | <0.001 | ||
| Colorectal cancer | 2,164 (19.8) | 325 (14.0) | <0.001 | ||
| Breast cancer | 4,013 (12.6) | 898 (18.4) | <0.001 | ||
| Assessed at high risk for4: | |||||
| Lung cancer | 13,249 (21.9) | 2,216 (27.8) | < 0.001 | ||
| Esophageal cancer | 9,796 (16.2) | 1,828 (22.9) | < 0.001 | ||
| Gastric cancer | 11,151 (18.5) | 2,055 (25.8) | < 0.001 | ||
| Liver cancer | 9,237 (15.3) | 1,634 (20.5) | < 0.001 | ||
| Colorectal cancer | 11,426 (18.9) | 2,008 (25.2) | < 0.001 | ||
| Breast cancer | 6,458 (20.3) | 1,295 (26.6) | < 0.001 | ||
Values are presented as number (%).
SD, standard deviation; RR, relative risk.
1 Two participants’ ethnicities were missing and 1,760 participants’ ethnicities were neither Han nor Mongolian, and were thus excluded from the analysis; Only Han and Mongolian participants were included in the above analysis (n=68,349).
2 For the categories of “average consumption (per week)” in different types of food: “not much” of fresh vegetables, fresh fruits, red meat, coarse grains was respectively defined as <2,500 g, <1,250 g, <350 g, and <500 g/wk.
3 Meeting the recommended amount of fresh vegetables, fresh fruits, red meat, coarse grains as respectively defined as ≥2,500 g, ≥1,250 g, ≥350 g, and ≥500 g/wk.
4 Assessed at high risk in the targeted 6 types of cancer was defined as a RR ≥1.50 using an established risk score system based on the Harvard Risk Index.
CI, confidence interval.
1 None of the differences in incidence/mortality density between Han and Mongolian ethnicity, regardless of the sex category showed statistical significance (all p-values >0.05).
2 Two participants’ ethnicities were missing and 1,760 participants’ ethnicities were neither Han nor Mongolian, and were thus excluded from the analysis; Only Han and Mongolian participants were included in the above analysis (n=68,349).
- 1. de Koning HJ, van der Aalst CM, de Jong PA, Scholten ET, Nackaerts K, Heuvelmans MA, et al. Reduced lung-cancer mortality with volume CT screening in a randomized trial. N Engl J Med 2020;382:503-513.ArticlePubMed
- 2. Zhang N, Li Y, Chang X, Lei F, Ma H, Liu J, et al. Long-term effectiveness of one-time endoscopic screening for esophageal cancer: a community-based study in rural China. Cancer 2020;126:4511-4520.ArticlePubMedPDF
- 3. Xia R, Zeng H, Liu W, Xie L, Shen M, Li P, et al. Estimated cost-effectiveness of endoscopic screening for upper gastrointestinal tract cancer in high-risk areas in China. JAMA Netw Open 2021;4:e2121403.ArticlePubMedPMC
- 4. Campbell C, Douglas A, Williams L, Cezard G, Brewster DH, Buchanan D, et al. Are there ethnic and religious variations in uptake of bowel cancer screening? A retrospective cohort study among 1.7 million people in Scotland. BMJ Open 2020;10:e037011.ArticlePubMedPMC
- 5. Liu D, Schuchard H, Burston B, Yamashita T, Albert S. Interventions to reduce healthcare disparities in cancer screening among minority adults: a systematic review. J Racial Ethn Health Disparities 2021;8:107-126.ArticlePubMedPDF
- 6. Wyatt LC, Patel S, Kranick JA, Raveis VH, Ravenell JE, Yi SS, et al. Disparities in colorectal cancer screening among South Asians in New York City: a cross-sectional study. J Cancer Educ 2022;37:1510-1518.ArticlePubMedPDF
- 7. Oshiro CE, Frankland TB, Mor J, Wong CP, Martinez YT, Aruga CK, et al. Lung cancer screening by race and ethnicity in an integrated health system in Hawaii. JAMA Netw Open 2022;5:e2144381.ArticlePubMedPMC
- 8. Gordon NP, Lin TY, Rau J, Lo JC. Aggregation of Asian-American subgroups masks meaningful differences in health and health risks among Asian ethnicities: an electronic health record based cohort study. BMC Public Health 2019;19:1551.ArticlePubMedPMCPDF
- 9. DeRouen MC, Canchola AJ, Thompson CA, Jin A, Nie S, Wong C, et al. Incidence of lung cancer among never-smoking Asian American, Native Hawaiian, and Pacific Islander females. J Natl Cancer Inst 2022;114:78-86.ArticlePubMedPDF
- 10. Jain B, Ng K, Santos PM, Taparra K, Muralidhar V, Mahal BA, et al. Prostate cancer disparities in risk group at presentation and access to treatment for Asian Americans, Native Hawaiians, and Pacific Islanders: a study with disaggregated ethnic groups. JCO Oncol Pract 2022;18:e204-e218.ArticlePubMed
- 11. Lowder D, Rizwan K, McColl C, Paparella A, Ittmann M, Mitsiades N, et al. Racial disparities in prostate cancer: a complex interplay between socioeconomic inequities and genomics. Cancer Lett 2022;531:71-82.ArticlePubMedPMC
- 12. Wemrell M, Vicente RP, Merlo J. Mapping sociodemographic and geographical differences in human papillomavirus non-vaccination among young girls in Sweden. Scand J Public Health 2023;51:288-295.ArticlePubMedPDF
- 13. Melkonian SC, Jim MA, Pete D, Poel A, Dominguez AE, EchoHawk A, et al. Cancer disparities among non-Hispanic urban American Indian and Alaska Native populations in the United States, 1999-2017. Cancer 2022;128:1626-1636.ArticlePubMedPDF
- 14. Xi Y, Tian Q, Na B, Han K, Duan M, Zhang X, et al. Protocol of the Inner Mongolian Healthy Aging Study (IMAGINS): a longitudinal cohort study. BMC Public Health 2022;22:115.ArticlePubMedPMCPDF
- 15. Li M, Wang D, Wang Y, Sun G, Song W, Zhang B, et al. Association of TP53 codon 72 genotype polymorphism and environmental factors with esophageal squamous cell carcinoma in the Mongolian population of the Chinese region of Inner Mongolia. Oncol Lett 2017;14:1484-1490.ArticlePubMedPMC
- 16. Guo W, Du M, Sun D, Zhao N, Hao Z, Wu R, et al. The effect characteristics of temperature on stroke mortality in Inner Mongolia and globally. Int J Biometeorol 2019;63:159-166.ArticlePubMedPDF
- 17. Chan DN, So WK. A systematic review of randomised controlled trials examining the effectiveness of breast and cervical cancer screening interventions for ethnic minority women. Eur J Oncol Nurs 2015;19:536-553.ArticlePubMed
- 18. China Statistics Press. Inner Mongolia statistical yearbook 2021. [cited 2022 Aug 1]. Available from: http://tj.nmg.gov.cn/files_pub/content/PAGEPACK/83e5521da4e94d50ab45483b58e5fa7e/zk/indexch.htm (Chinese).
- 19. Guo L, Zhang S, Liu S, Zheng L, Chen Q, Cao X, et al. Determinants of participation and detection rate of upper gastrointestinal cancer from population-based screening program in China. Cancer Med 2019;8:7098-7107.ArticlePubMedPMCPDF
- 20. Guo LW, Chen Q, Shen YC, Meng QC, Zheng LY, Wu Y, et al. Evaluation of a low-dose computed tomography lung cancer screening program in Henan, China. JAMA Netw Open 2020;3:e2019039.ArticlePubMedPMC
- 21. Wang Y, Chen H, Li N, Ren J, Zhang K, Dai M, et al. Ultrasound for breast cancer screening in high-risk women: results from a population-based cancer screening program in China. Front Oncol 2019;9:286.ArticlePubMedPMC
- 22. Chen H, Li N, Shi J, Ren J, Liu C, Zhang Y, et al. Comparative evaluation of novel screening strategies for colorectal cancer screening in China (TARGET-C): a study protocol for a multicentre randomised controlled trial. BMJ Open 2019;9:e025935.ArticlePubMedPMC
- 23. Colditz GA, Atwood KA, Emmons K, Monson RR, Willett WC, Trichopoulos D, et al. Harvard report on cancer prevention volume 4: Harvard Cancer Risk Index. Cancer Causes Control 2000;11:477-488.PubMed
- 24. Chen H, Li N, Ren J, Feng X, Lyu Z, Wei L, et al. Participation and yield of a population-based colorectal cancer screening programme in China. Gut 2019;68:1450-1457.ArticlePubMed
- 25. DeRouen MC, Thompson CA, Canchola AJ, Jin A, Nie S, Wong C, et al. Integrating electronic health record, cancer registry, and geospatial data to study lung cancer in Asian American, Native Hawaiian, and Pacific Islander ethnic groups. Cancer Epidemiol Biomarkers Prev 2021;30:1506-1516.ArticlePubMedPMCPDF
- 26. Kauppila JH, Ohtonen P, Rantanen T, Tyrväinen T, Toikkanen V, Pääaho M, et al. Cohort profile: gastric cancer in the population-based, Finnish National Esophago-Gastric Cancer-Cohort (FINEGO) study. BMJ Open 2020;10:e039574.ArticlePubMedPMC
- 27. Yang Z, Wang F, Tan F, Cao W, Xu Y, Qin C, et al. Menstrual factors, reproductive history, and risk of lung cancer: a multi-center population-based cohort study in Chinese females. Transl Lung Cancer Res 2021;10:3912-3928.ArticlePubMedPMC
- 28. Perraillon MC, Liang R, Sabik LM, Lindrooth RC, Bradley CJ. The role of all-payer claims databases to expand central cancer registries: experience from Colorado. Health Serv Res 2022;57:703-711.ArticlePubMedPDF
- 29. Wu Y, Zhou H, Ma X, Shi Y, Xue H, Zhou C, et al. Using standardised patients to assess the quality of medical records: an application and evidence from rural China. BMJ Qual Saf 2020;29:491-498.ArticlePubMed
- 30. Booth CM, Karim S, Mackillop WJ. Real-world data: towards achieving the achievable in cancer care. Nat Rev Clin Oncol 2019;16:312-325.ArticlePubMedPDF
- 31. Lin H, Tang X, Shen P, Zhang D, Wu J, Zhang J, et al. Using big data to improve cardiovascular care and outcomes in China: a protocol for the CHinese Electronic health Records Research in Yinzhou (CHERRY) Study. BMJ Open 2018;8:e019698.ArticlePubMedPMC
- 32. Eads JR. Cardiovascular concerns in the management of esophageal cancer patients. JACC CardioOncology 2021;3:722-724.ArticlePubMedPMC
- 33. Catalona WJ. Prostate cancer screening. Med Clin North Am 2018;102:199-214.ArticlePubMedPMC
- 34. Li C, Liu Y, Shi G, Mi B, Zeng L, Li Q, et al. Cohort profile: regional ethnic cohort study in Northwest China. Int J Epidemiol 2022;51:e18-e26.ArticlePubMedPDF
- 35. Mamas MA, Matetic A. How common is pre-existing cardiovascular disease in cancer patients: what do we know? Does it matter? JACC CardioOncology 2022;4:254-257.ArticlePubMedPMC
- 36. Gensheimer MF, Narasimhan B, Henry AS, Wood DJ, Rubin DL. Accuracy of electronic medical record follow-up data for estimating the survival time of patients with cancer. JCO Clin Cancer Inform 2022;6:e2200019.ArticlePubMedPMC
- 37. Lin L, Li Z, Yan L, Liu Y, Yang H, Li H. Global, regional, and national cancer incidence and death for 29 cancer groups in 2019 and trends analysis of the global cancer burden, 1990-2019. J Hematol Oncol 2021;14:197.ArticlePubMedPMCPDF
- 38. Pan R, Zhu M, Yu C, Lv J, Guo Y, Bian Z, et al. Cancer incidence and mortality: a cohort study in China, 2008-2013. Int J Cancer 2017;141:1315-1323.ArticlePubMedPDF
 PubReader
 ePub Link
 Cite
Cite


