Articles
- Page Path
- HOME > Epidemiol Health > Volume 45; 2023 > Article
-
Original Article
Trends and all-cause mortality associated with multimorbidity of non-communicable diseases among adults in the United States, 1999-2018: a retrospective cohort study -
Mengzi Sun
 , Ling Wang, Xuhan Wang, Li Tong, Lina Jin, Bo Li
 -
Epidemiol Health 2023;45:e2023023.
DOI: https://doi.org/10.4178/epih.e2023023
Published online: February 14, 2023
Department of Epidemiology and Biostatistics, School of Public Health, Jilin University, Changchun, China
- Correspondence: Lina Jin Department of Epidemiology and Biostatistics, School of Public Health, Jilin University, 1163 Xinmin Avenue, Changchun 130021, China E-mail: jinln@jlu.edu.cn
- Co-correspondence: Bo Li Department of Epidemiology and Biostatistics, School of Public Health, Jilin University, 1163 Xinmin Avenue, Changchun 130021, China E-mail: li_bo@jlu.edu.cn
© 2023, Korean Society of Epidemiology
This is an open-access article distributed under the terms of the Creative Commons Attribution License (http://creativecommons.org/licenses/by/4.0/), which permits unrestricted use, distribution, and reproduction in any medium, provided the original work is properly cited.
- 3,781 Views
- 106 Download
Abstract
-
OBJECTIVES
- Multimorbidity of non-communicable diseases (NCDs) has brought enormous challenges to public health, becoming a major medical burden. However, the patterns, temporal trends, and all-cause mortality associated with NCD multimorbidity over time have not been well described in the United States.
-
METHODS
- All adult participants were sourced from nationally representative data from the National Health and Nutrition Examination Survey. In total, 55,081 participants were included in trend analysis, and 38,977 participants were included in Cox regression.
-
RESULTS
- The 5 NCDs with the largest increases over the study period were diabetes, osteoporosis, obesity, liver conditions, and cancer. The estimated prevalence of multimorbidity increased with age, especially for middle-aged participants with 5 or more NCDs; in general, the prevalence of NCD multimorbidity was higher among females than males. Participants with 5 or more NCDs were at 4.49 times the risk of all-cause mortality of participants without any diseases. Significant interactions were found between multimorbidity and age group (p for interaction <0.001), race/ethnicity (p for interaction<0.001), and educational attainment (p for interaction=0.010).
-
CONCLUSIONS
- The prevalence of multiple NCDs significantly increased from 1999 to 2018. Those with 5 or more NCDs had the highest risk of all-cause mortality, especially among the young population. The data reported by this study could serve as a reference for additional NCD research.
- Multimorbidity is the co-occurrence of 2 or more diseases [1], in which no single condition holds priority over any of the co-occurring conditions [2]. Multimorbidity of non-communicable diseases (NCDs) is extremely common and is considered an enormous challenge in public health, constituting a major medical burden since the last century [3]. Previous studies have indicated that the prevalence of multimorbidity is growing along with the increase in life expectancy and global population aging [4,5]. A separate retrospective observational study in the United Kingdom reported that 20% of patients had at least 2 chronic conditions [6].
- Additionally, a systematic analysis for the Global Burden of Disease Study in 1990-2013 indicated that the multimorbidity of NCDs becomes substantially more frequent with age [7]; another study similarly showed that the prevalence of NCD multimorbidity increases with age among United States adults [8]. Furthermore, most deaths in developed countries are thought to occur in people over 65 years old with multiple chronic conditions causing or contributing to death [9]. Due to the complexity of NCD multimorbidity, it is essential to examine associated patterns utilizing nationally representative data. In addition, socio-demographic correlates of NCD multimorbidity have not yet been systematically evaluated in the population.
- For these reasons, we examined the trends and all-cause mortality associated with multimorbidity of NCDs in United States adults, both overall and according to socio-demographic characteristics, utilizing data from the National Health and Nutrition Examination Survey (NHANES). The results of this study could inform additional NCD research.
INTRODUCTION
- Study population
- The NHANES, a population-based survey designed to collect information on the health and nutrition of United States households, has included a nationally representative, complex, stratified, multistage probability sample of the civilian non-institutionalized United States population in continuous 2-year cycles since 1999 [10].
- The present study included 3 age groups: young adults (20-39 years old), middle-aged adults (40-64 years old), and older adults (≥ 65 years old). Information on socio-demographic characteristics, weight, and 48 diseases were combined into a single dataset for each data cycle from 1999-2000 to 2017-2018. The trend of NCD multimorbidity is reflected in the prevalence of 2 or more diseases in adults over the age of 20 years from 1999-2000 to 2017-2018. The trends of each NCD were examined by age (20-39, 40-64, and ≥ 65 years) and sex (male and female). Data on all-cause mortality were obtained using a probabilistic match between NHANES and the National Death Index death certificate records.
- This study had 2 parts. First, in a serial cross-sectional study, we included a total of 55,081 participants from 1999-2018 for the trend analysis. Second, in a retrospective study, 38,977 participants from 1999-2018 were included in the all-cause mortality analysis due to missing covariates. The flowchart of participant inclusion is shown in Supplementary Material 1.
- Disease definitions
- For the NHANES (1999-2018), NCDs were diagnosed based on several questions. Diabetes was defined as meeting any of the following conditions: ever having been diagnosed with diabetes by a doctor; currently taking insulin; ever having taken diabetes pills to lower blood sugar; having a fasting glucose concentration of at least 126 mg/dL; or having a hemoglobin A1c level of at least 6.5% [11,12]. Hypertension was defined as meeting any of the following conditions: ever having been diagnosed with high blood pressure by a doctor; ever having been told to take prescription medication for hypertension; currently taking prescription medicine for hypertension; or exhibiting an average systolic blood pressure greater than 130 mmHg or a diastolic blood pressure greater than 80 mmHg in the NHANES examination section [13]. Hyperlipidemia was defined as meeting any of the following conditions: ever having been informed of having a high cholesterol level by a doctor; ever having been told to take a prescription for cholesterol; currently taking prescription medicine for cholesterol; or having a low-density lipoprotein level of at least 190 mg/mL [14]. Obesity was defined as a body mass index greater than 30 kg/m2 [2,15].
- The following NCDs were identified based on the question “Have you ever been told that you have this disease by a doctor?”: asthma, arthritis, congestive heart failure, coronary heart disease, heart attack, stroke, emphysema, thyroid problem, psoriasis, gout, chronic obstructive pulmonary disease, gout, weak or failing kidneys, kidney stones, osteoporosis/brittle bones, and chronic bronchitis. Cancers were identified based on the questions “Has a doctor ever told you that you had cancer or malignancy?” and, if so, “What kind of cancer?”. The cancers included bladder cancer, blood cancer, bone cancer, brain cancer, breast cancer, cervical cancer, colon cancer, esophageal cancer, gallbladder cancer, kidney cancer, larynx/windpipe cancer, leukemia, liver cancer, lung cancer, lymphoma/Hodgkin lymphoma, melanoma, mouth/tongue/lip cancer, nervous system cancer, ovarian cancer, pancreatic cancer, prostate cancer, rectal cancer, non-melanoma skin cancer, unknown skin cancer, soft tissue cancer, stomach cancer, testicular cancer, thyroid cancer, uterine cancer, and any other type of cancer.
- Assessment of socio-demographic and lifestyle characteristics
- Self-reported socio-demographic characteristics included age, sex, race/ethnicity (Mexican American, other Hispanic, non-Hispanic White, non-Hispanic Black, or other race), annual household income (< US$25,000, 25,000-75,000, or ≥ 75,000), educational attainment (less than high school, high school, or more than high school), physical activity (never, vigorous, or moderate), and marriage status (live together or single). Smoking status was divided into 3 categories. Non-smokers were defined as those who had smoked fewer than 100 cigarettes in their lifetime, former smokers were defined as those who had smoked at least 100 cigarettes but did not smoke currently, and current smokers were defined as participants who had smoked at least 100 cigarettes and reported the number of cigarettes smoked per day in the past 30 days [16]. Drinking status was similarly divided into 3 categories; non-drinkers were defined as participants who had consumed fewer than 12 alcohol-based drinks in their lifetime, former drinkers were defined as participants who had consumed at least 12 drinks in their lifetime but not in the past year, and current drinkers were defined as participants who had consumed at least 12 drinks in the past year. Current drinkers reported the number of drinks consumed per week [16]. Weight was measured during the physical examination at the mobile examination center, and body mass index was calculated as weight in kilograms divided by height in meters squared. The survey had 2 parts: a home interview and a health examination. During the in-home interview, participants were asked questions about health status and disease history. The examination component consisted of medical tests, including blood pressure measurement, and examinations administered by highly trained medical personnel [17].
- Statistical analysis
- For all analyses, we used NHANES interview sample weights, stratification, and clustering of the complex sampling design adjusted with non-response, non-coverage, and unequal probabilities of selection. All estimates were weighted to be nationally representative [10]. We categorized NCDs in the following format: S[χ]=[i | participant i suffers from×NCD(s)]. That is, S[0] is the subpopulation with no NCDs; S[1] is the subpopulation with only 1 NCD; S[2-4] is the subpopulation with 2 to 4 NCDs; and S[5+] is the subpopulation with 5 or more NCDs. The number and weighted prevalence of S[0], S[1], S[2-4], and S[5+] were calculated by age, sex, race/ethnicity, annual household income, educational attainment, physical activity, and marriage status for each 2-year NHANES cycle between 1999 and 2018.
- Estimates of the crude weighted prevalence rates of the S[0], S[1], S[2-4], and S[5+] subpopulations were calculated by NHANES cycle among all adults, with and without cancer. The p for trend was estimated using the survey cycle as a continuous variable and survey-weighted logistic regression. The ratio of prevalence was estimated using the relative risk in complex samples via SPSS (IBM Corp., Armonk, NY, USA).
- The statistical significance of trends was assessed at the 2-sided α= 0.05 level. In the Results section, an increase refers to a p for trend< 0.05 and a ratio> 1, a decrease refers to a p for trend< 0.05 and a ratio < 1, and a stable finding refers to a p for trend ≥ 0.05.
- To determine the risk of all-cause mortality associated with each number of NCDs, we created Cox proportional hazards models while adjusting for age, sex, race/ethnicity, educational attainment, annual household income, physical activity, marriage status, smoking status, and drinking status. Although S[2+] represents multimorbidity, separate S[2-4] and S[5+] categories were examined for further survival analysis, which could then be used to explore the impact of the number of multimorbidities on all-caused death. Hazard ratios (HRs) with 95% confidence intervals (CIs) were estimated using univariate and multivariable Cox proportional hazards models with time in the study as the underlying time metric for calculation. Sensitive analysis of Cox regression was conducted via stratified analysis, and the p-interaction between multimorbidity and each stratified variable was also tested. All statistical tests were 2-sided, and p-values of < 0.05 were considered to indicate statistical significance. Data were analyzed using SPSS version 26.0 (IBM Corp., Armonk, NY, USA).
- Ethics statement
- The NHANES protocols were approved by the Institutional Review Board of the National Center for Health Statistics of the Centers for Disease Control and Prevention (NCHS IRB/ERB Protocol #98-12, Protocol #2005-06, Protocol #2011-17, Protocol #2018-01). Written informed consent was obtained from each participant before participation in this study.
MATERIALS AND METHODS
- In total, 101,316 individuals participated in the 10 survey cycles (1999-2018). After excluding individuals under the age of 20 years, 55,081 adults were included in this study. The sample size per cycle ranged from 4,880 to 6,218 participants, from 1999-2000 to 2017-2018. Unweighted sample sizes in the 2017-2018 cycle by socio-demographic characteristics are presented in Table 1, and the 1999-2000 to 2015-2016 cycles are illustrated in the Supplementary Materials 2-10.
- In the 2017-2018 cycle, a substantial proportion of the population had multimorbidity. The estimated prevalence rates of S[2-4] and S[5+] among adults were 40.8% and 18.1%, respectively. Most of the participants without multimorbidity were young adults. Adults aged 40 years to 64 years old had the highest proportion of S[2-4], while older adults had the highest proportion of S[5+]. The estimated prevalence of multimorbidity across cycles ranged from 33.8% to 40.9% for S[2-4] and 5.7% to 18.1% for S[5+] (Supplementary Materials 2-10).
- Relative to the 1999-2000 cycle, a significant increase was noted in the 2017-2018 estimated prevalence of multimorbidity (p for trend < 0.001), especially for S[5+]. In contrast, the estimated prevalence rates of S[0] and S[1] showed statistically significant declines from 1999 onward (p for trend < 0.001). Throughout all 10 cycles, a substantial proportion of the population experienced 2 to 4 NCDs (33.8 to 40.9%; p for trend < 0.001); additionally, although a minority of individuals reported having 5 or more NCDs, the estimated prevalence of the S[5+] condition increased significantly over time (5.7 to 18.1%, p for trend < 0.001; Table 2). The estimated prevalence of NCD multimorbidity was lower among the participants without cancer than among all adults.
- The estimated prevalence rate of each NCD and cancer among all adults in 1999-2018 is shown in Supplementary Material 11. Among the 20 NCDs, the 5 most prevalent were hypertension (35.2%), obesity (33.4%), hyperlipidemia (31.4%), arthritis (24.4%), and asthma (13.9%). The prevalence of most NCDs increased over the 20 years observed (p for trend < 0.05), and the 5 with the largest increases were diabetes, osteoporosis, obesity, liver conditions, and cancer. The estimated prevalence of each cancer is also shown in Supplementary Material 12.
- The most common 10 pairs of multimorbid NCDs were almost identical throughout all 10 cycles and included hypertension, hyperlipidemia, obesity, arthritis, and diabetes. In the 2013-2014 cycle, the estimated prevalence of hypertension and hyperlipidemia (22.0%) was the highest of these pairs, and a significant upward trend was noted after 1999 (p for trend < 0.001). The estimated prevalence of the top 10 pairs of multimorbidities significantly increased throughout the 10 cycles (p for trend < 0.001; Table 3).
- Next, we divided participants into age and sex subgroups to describe the estimated prevalence of each NCD, as shown in Supplementary Material 13. Except for asthma, all NCDs differed significantly in prevalence among age subgroups. Obesity had the highest estimated prevalence in the middle-aged group, while the other conditions were most prevalent among older adults. Compared with females, males had a higher estimated prevalence of congestive heart failure, coronary heart disease, heart attack, gout, hypertension, hyperlipidemia, and angina and a lower estimated prevalence of asthma, arthritis, thyroid problems, osteoporosis, chronic bronchitis, and cancers (p< 0.05).
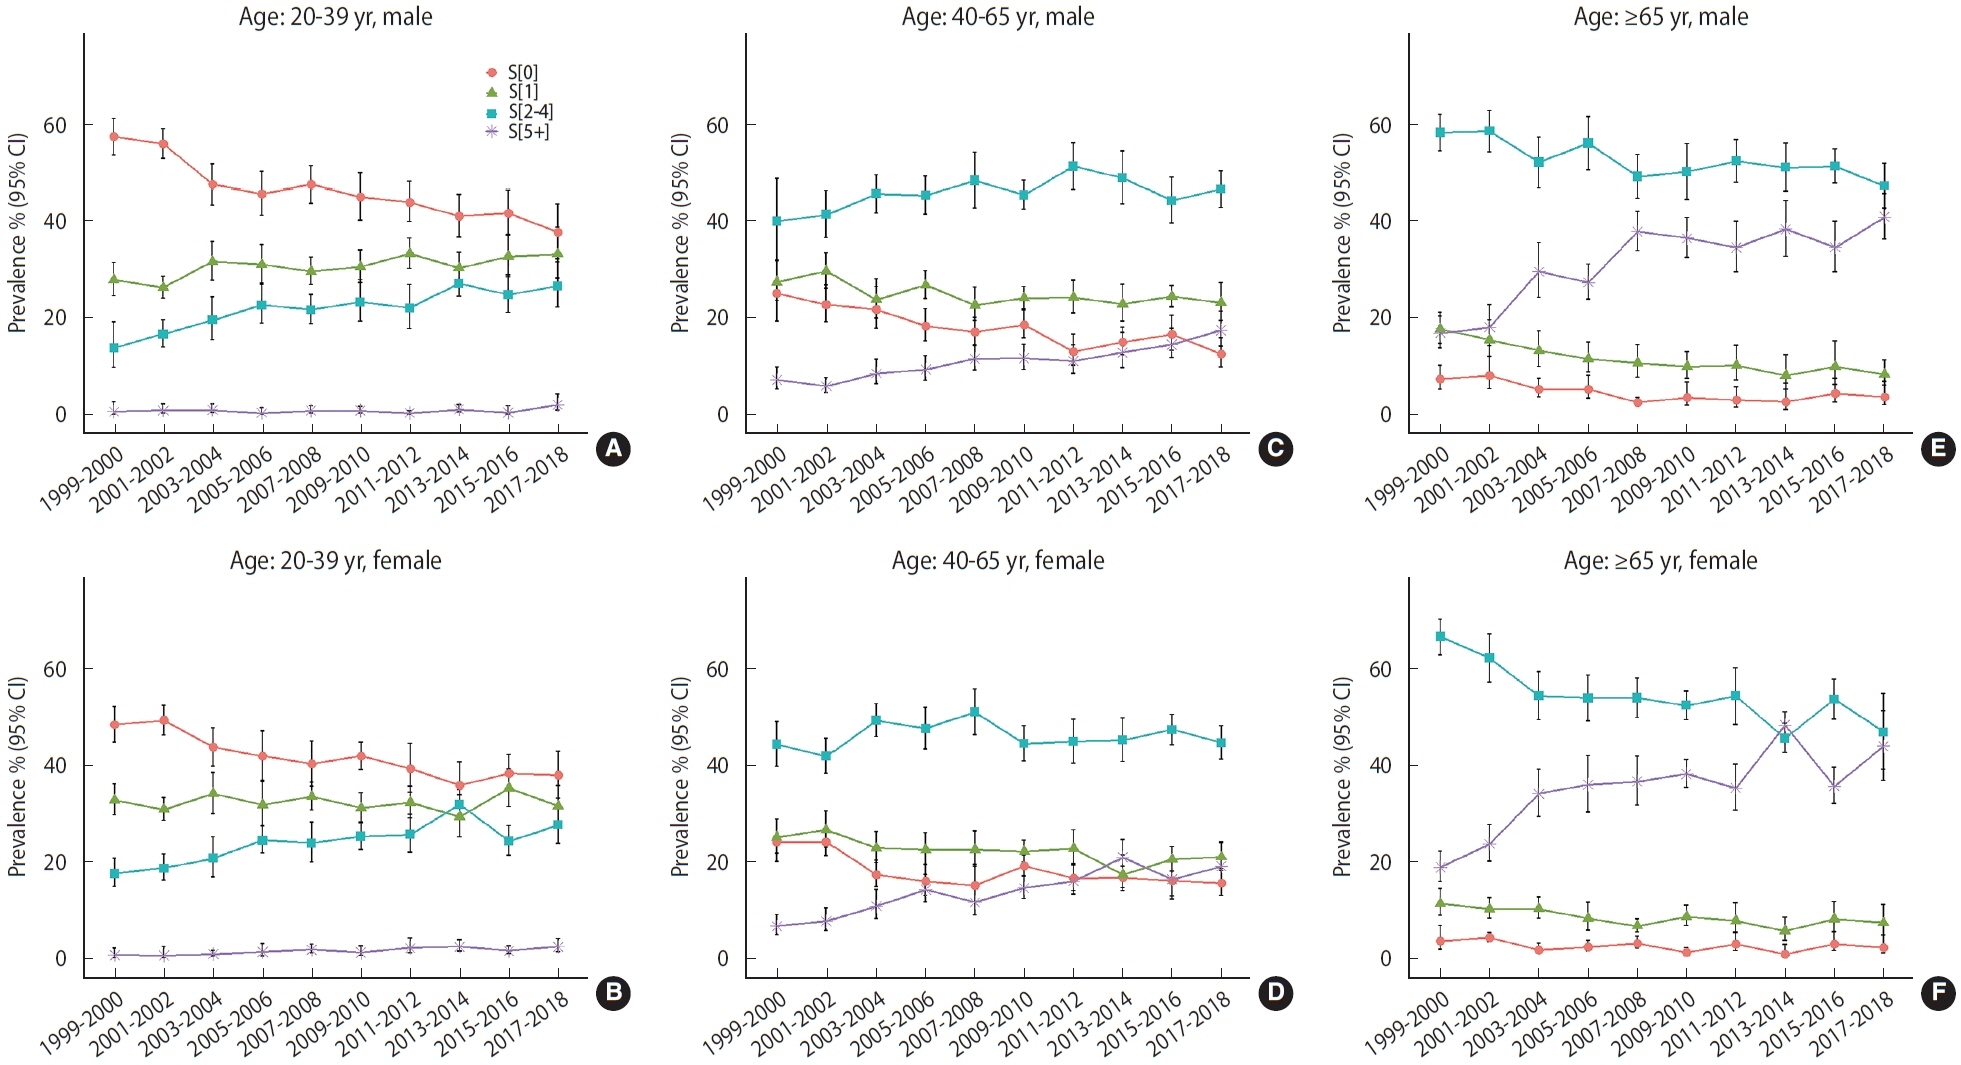
- Figure 1 shows the estimated prevalence of number of NCDs by age and sex groups. In general, the estimated prevalence of S[0] declined, and the estimated prevalence of multimorbidity significantly increased. The estimated prevalence of multimorbidity was lower than that of S[0] in young adults, but the estimated prevalence of multimorbidity was higher in adults aged over 40 years, especially for those aged 65 years or more. The estimated prevalence of multimorbidity increased with age, and the trends of S[5+] exhibited an obvious acceleration from middle age onward. Compared with middle-aged adults, the older population exhibited an even higher estimated prevalence of multimorbidity, particularly among females.
- We next explored the all-cause mortality of patients with NCD multimorbidity using Cox proportional hazards models based on participants from 1999-2018, as shown in Table 4. Survival curves by number of NCDs are shown in Supplementary Material 14. Compared with the population with no disease, participants in the S[5+] category had 4.49 times the risk of all-cause mortality after adjustment. We then explored the interaction between each variable and multimorbidity. As shown in Table 5, interactions were found between multimorbidity and age group (p for interaction< 0.001), race/ethnicity (p for interaction< 0.001), and educational attainment (p for interaction= 0.010). The HRs of all-cause mortality increased with the number of multimorbidities. Notably, within the S[5+] subcategory, the HR was highest among the young population (HR, 17.85; 95% CI, 8.33 to 38.28) and lowest among the elderly (HR, 2.10; 95% CI, 1.59 to 2.78). Among the subgroups categorized by race/ethnicity, the “other Hispanic” category displayed the highest HRs. Regarding educational attainment, both the groups with lower-than-high-school and higher-than-high-school education levels had higher HRs of all-cause mortality than the group with a high school education.
RESULTS
- In this nationally representative sample of the adult population in the United States, the estimated prevalence of multimorbidity was consistently high and significantly increased from 1999 to 2018, especially for the middle-aged and elderly. Furthermore, the estimated prevalence of ≥ 5 multimorbidities accelerated starting in middle age. Last but most importantly, participants with 5 or more NCDs had the highest risk of all-cause mortality relative to participants without any diseases, especially among the young population. To our knowledge, this was the first study of the prevalence of multimorbidity and all-cause mortality associated with NCDs in the United States, and the data reported in this study could inform additional NCD research.
- Until now, the prevention and treatment of NCDs in the population have primarily been focused on single NCDs rather than the multimorbidity of these diseases. However, the prevention of multimorbidity cannot simply be viewed as an accumulation of many instances of single NCD prevention, but rather as a more effective and easier overall strategy to implement. Furthermore, populations with NCD multimorbidity are at an increased risk of mortality, morbidity, hospitalization, high medical costs, and adverse events [18], and this particularly heavy additional burden may be imposed by multimorbidity [19,20]. Our study revealed that the percentage of the population experiencing a single NCD declined over time, whereas the prevalence of NCD multimorbidity was high and trended upward. Therefore, the importance of multimorbidity prevention is obvious. In particular, understanding the situation and trends in the multimorbidity of NCDs is a critical step before population-wide strategies to prevent NCD multimorbidity can be developed and implemented.
- The prevalence of multimorbidity is high not only in the United States, but also in other countries. A large United Kingdombased study found that 42% of the population had at least 1 NCD and 23% had multimorbidity, with two-thirds of people aged 65 years or over having multimorbidity [21]. Among Canadians aged 40 years, the reported prevalence rates of 2 or more and 3 or more chronic conditions were 26.5% and 10.2%, respectively [22]. Another previous study revealed that NCD multimorbidity had a monotonic increasing trend from 2003 to 2013 [23]. A study on United States adults reported that the prevalence of multiple chronic conditions increased with age [8], which was consistent with our study. These increasing trends suggest that we should focus on the health of the entire population with regard to multimorbidity. Moreover, with the growing number of elderly people in the world, the prevention of multimorbidity has become an urgent and serious problem.
- Interestingly, the 10 most common pairs of multimorbid NCDs were almost identical between 1999 and 2016, suggesting that the morbidities may have potential mechanisms or risk factors in common. A study among older adults in Florida and the United States as a whole showed that the most prevalent pairs of chronic conditions were hyperlipidemia and hypertension, hypertension and ischemic heart disease, and diabetes and hypertension [23], which aligned with our findings. Another study reported that 73% of hypertensive patients presented with dyslipidemia [24], perhaps because hypercholesterolemia may increase sensitivity to some of the mechanisms involved in blood pressure elevation [25]. The prevalence of obesity has risen globally over the past 4 decades [26], and the associations of obesity with hypertension and hyperlipidemia have been widely explored [27,28]. Moreover, arthritis co-occurred with hypertension, hyperlipidemia, obesity, and diabetes, potentially because the promoted systemic cardiovascular risk factors are produced in locally affected joints through proinflammatory cytokines (including dyslipidemia and oxidative stress) [29,30]. Additionally, individuals with one of these NCDs should pay special attention to preventing other NCDs; that is, multimorbidity studies can also provide effective preventive strategies. Therefore, relative to studies of a single NCD, studies of multimorbidity may provide a novel and creative rationale to better understand the mechanisms and prevention of NCDs, since potential common mechanisms or risk factors would be highly enhanced in multimorbidity.
- Furthermore, we observed an apparent acceleration in the prevalence of 5 or more NCDs beginning in middle age. This indicates that middle-aged individuals form the key population for multimorbidity prevention. Although a consensus may already exist that the middle-aged and elderly tend to experience the most NCDs, we identified and quantified the specific level of risk. Based on our findings, interventions to prevent multimorbidity should be enacted earlier, in middle age, rather than in the elderly. Other-wise, the multimorbidity of this subpopulation would contribute a heavy burden to society in the future, including an increasing risk of all-cause mortality.
- Notably, the all-cause mortality associated with at least 5 NCDs was highest in the young population, rather than the elderly, as one may assume. Additionally, we identified interactions of the number of NCDs with both race and educational attainment. The patterns of NCDs clearly differed among races. Regarding education, one study indicated that all-cause mortality rates were approximately 2 times higher among adults with the least education than among those with the most [31]. Another study indicated that veterans’ mortality rates varied substantially by racial and ethnic group [32]. However, the “other Hispanic” and “higher than high school” populations had the highest risks of all-cause mortality associated with multimorbidity. Therefore, intervention strategies and measures should be applied to these key populations before the situation deteriorates, and the prevention of multimorbidity should be implemented at an age prior to the most seriously impacted age group. Among patients with multimorbidity, the population with 5 or more NCDs requires special attention; furthermore, within that population, young people should be a particular focus.
- This study has several limitations. First, self-reported health conditions may not reflect the true number of NCDs. However, self-report bias was unlikely to affect the observed secular trends over time. Second, the prevalence was not measured over the entire year, but rather was based on the pre-existence of the condition prior to the date of the investigation. Third, participants who re-fused to answer or were not familiar with the conditions and thus had missing values were regarded as not having the NCDs, which could result in underestimation of prevalence. Overall, measuring and understanding the prevalence of multimorbidity is both critical and urgent for the early prevention of NCDs.
- In conclusion, the estimated prevalence of NCD multimorbidity was consist-ently high and displayed a significant upward trend from 1999 through 2018, especially for those aged over 40 years with 5 or more NCDs, and this prevalence accelerated beginning in middle age. Meanwhile, the 10 most common pairs of multimorbid conditions were nearly identical between 1999 and 2018, and the estimated prevalence rates of these pairs also appeared to be increasing. The number of NCDs and the age of participants were associated with all-cause mortality. Populations with 5 or more NCDs had the highest risk of all-cause mortality, especially young adults.
DISCUSSION
- The data described in the manuscript, code book, and analytic code will be made publicly and freely available without restriction at https://www.cdc.gov/nchs/nhanes.
DATA AVAILABILITY
SUPPLEMENTARY MATERIALS
Supplementary Material 1.
Supplementary Material 2.
Supplementary Material 3.
Supplementary Material 4.
Supplementary Material 5.
Supplementary Material 6.
Supplementary Material 7.
Supplementary Material 8.
Supplementary Material 9.
Supplementary Material 10.
Supplementary Material 11.
Supplementary Material 12.
Supplementary Material 13.
Supplementary Material 14.
-
CONFLICT OF INTEREST
The authors have no conflicts of interest to declare for this study.
-
FUNDING
This study was provided by the National Natural Science Foundation of China (No. 81973129) and the Natural Science Foundation of Science and Technology Department of Jilin Province, China (grant No. 20180101129JC).
-
AUTHOR CONTRIBUTIONS
Conceptualization: Sun M, Jin L, Li B. Data curation: Sun M, Wang L, Wang X. Formal analysis: Sun M, Wang L, Tong L. Funding acquisition: Li B, Jin L. Methodology: Sun M, Wang L. Project administration: Bo L, Jin L. Visualization: Sun M, Wang L. Writing – original draft: Sun M, Wang X, Tong L. Writing – review & editing: Sun M, Wang L, Bo L, Jin L.
NOTES
ACKNOWLEDGEMENTS

Values are presented as number (weighted %).
NCDs, non-communicable diseases; NHANES, National Health and Nutrition Examination Survey.
1 Participant characteristics are presented by number of NCDs: S[0] (no NCDs); S[1] (1 NCD), S[2-4] (2 to 4 NCDs), and S[5+] (5 or more NCDs); Sample size was weighted to be nationally representative.
2 Number of participants within each group may not sum to the overall value due to missing data; Similarly, weighted percentages may not sum to 100% due to missing data.
Values are presented as hazard ratio (95% confidence interval).
1 Model 1: mortality+number of NCDs; Model 2: model 1+age (20-39, 40-64, or ≥65 years), sex (male or female), race/ethnicity (Mexican American, other Hispanic, non-Hispanic White, non-Hispanic Black, or other race), and body mass index (kg/m2); Model 3: model 2+educational attainment (less than high school, high school, or more than high school), annual household income in dollars (<25,000, 25,000-75,000, or ≥75,000), physical activity (inactive, vigorous, or moderate), marital status (living together or single), smoking status (never, current, or former), and drinking status (never, current, or former).
| Variables2 | HR1 (95% CI) | HR2 (95% CI) | HR3 (95% CI) | p-interaction | |
|---|---|---|---|---|---|
| Sex | 0.308 | ||||
| Male (n=22,809) | 1.50 (1.15, 1.95) | 2.25 (1.73, 2.93) | 3.86 (2.85, 5.24) | ||
| Female (n=24,542) | 1.54 (1.10, 2.16) | 2.56 (1.83, 3.57) | 5.26 (3.71, 7.45) | ||
| Age (yr) | <0.001 | ||||
| 20-39 (n=16,467) | 1.73 (1.13, 2.65) | 2.18 (1.27, 3.75) | 17.85 (8.33, 38.28) | ||
| 40-64 (n=19,497) | 1.79 (1.22, 2.63) | 3.13 (2.26, 4.34) | 7.00 (4.85, 10.10) | ||
| ≥65 (n=11,387) | 0.86 (0.62, 1.20) | 1.16 (0.90, 1.49) | 2.10 (1.59, 2.78) | ||
| Race/ethnicity | <0.001 | ||||
| Mexican American (n=8,013) | 1.01 (0.71, 1.45) | 1.41 (0.98, 2.04) | 2.18 (1.37, 3.47) | ||
| Other Hispanic (n=3,764) | 2.73 (0.81, 9.18) | 4.48 (1.68, 11.97) | 12.28 (2.95, 51.01) | ||
| Non-Hispanic White (n=21,289) | 1.58 (1.20, 2.08) | 2.64 (2.03, 3.44) | 4.84 (3.60, 6.49) | ||
| Non-Hispanic Black (n=9,898) | 1.51 (0.98, 2.34) | 1.92 (1.26, 2.93) | 3.66 (2.23, 6.02) | ||
| Other race (n=4,387) | 2.79 (0.78, 10.01) | 2.72 (0.78, 9.52) | 9.96 (2.33, 42.48) | ||
| Educational attainment | 0.010 | ||||
| Less than high school (n=12,403) | 1.99 (1.38, 2.87) | 2.66 (1.93, 3.67) | 4.71 (3.18, 6.96) | ||
| High school (n=10,998) | 1.10 (0.76, 1.58) | 2.01 (1.42, 2.84) | 3.76 (2.58, 5.48) | ||
| More than high school (n=23,950) | 1.55 (1.15, 2.08) | 2.42 (1.79, 3.27) | 4.77 (3.36, 6.77) | ||
| Annual household income (US$) | 0.703 | ||||
| <25,000 | 1.69 (1.22, 2.36) | 2.94 (2.10, 4.12) | 5.33 (3.61, 7.86) | ||
| 25,000-75,000 | 1.47 (1.09, 1.97) | 2.25 (1.73, 2.93) | 4.34 (3.26, 5.79) | ||
| ≥75,000 | 1.40 (0.84, 2.35) | 1.85 (1.16, 2.94) | 3.70 (2.12, 6.44) | ||
| Marital status | 0.819 | ||||
| Living together | 1.44 (1.06, 1.97) | 2.18 (1.63, 2.91) | 4.10 (2.93, 5.72) | ||
| Single | 1.58 (1.19, 2.09) | 2.63 (2.01, 3.43) | 4.98 (3.74, 6.63) | ||
| Physical activity | 0.662 | ||||
| Never | 1.30 (0.95, 1.77) | 2.19 (1.63, 2.95) | 4.14 (2.96, 5.80) | ||
| Vigorous | 2.29 (1.07, 4.91) | 3.80 (1.73, 8.36) | 7.05 (3.16, 15.75) | ||
| Moderate | 1.61 (1.20, 2.17) | 2.29 (1.70, 3.10) | 4.37 (3.09, 6.17) | ||
| Smoking status | 0.448 | ||||
| Never | 1.37 (1.01, 1.85) | 2.09 (1.59, 2.74) | 3.83 (2.79, 5.27) | ||
| Current | 2.03 (1.48, 2.80) | 3.25 (2.34, 4.51) | 6.16 (4.15, 9.14) | ||
| Former | 1.07 (0.74, 1.55) | 1.69 (1.19, 2.40) | 3.32 (2.28, 4.84) | ||
| Drinking status | 0.233 | ||||
| Never | 1.83 (1.15, 2.92) | 2.29 (1.41, 3.74) | 3.90 (2.35, 6.47) | ||
| Current | 1.50 (1.20, 1.87) | 2.38 (1.92, 2.95) | 4.48 (3.45, 5.81) | ||
| Former | 1.25 (0.72, 2.17) | 2.33 (1.33, 4.05) | 5.02 (2.76, 9.13) | ||
HR, hazard ratio; CI, confidence interval; NCD, non-communicable disease.
1 HRs compared with population with no diseases. HR1: S[1] (1 NCD), HR2: S[2-4] (2 to 4 NCDs), HR3: S[5+] (5 or more NCDs).
2 Adjusted for age (20-39, 40-64, or ≥65 years), sex (male or female), race/ethnicity (Mexican American, other Hispanic, non-Hispanic White, non-Hispanic Black, or other race), body mass index (kg/m2), educational attainment (<high school, high school, or >high school), annual household income in dollars (<25,000, 25,000-75,000, or ≥75,000), physical activity (inactive, vigorous, or moderate), marital status (living together or single), smoking status (never, current, or former), and drinking status (never, current, or former); Of note, variables examined in this table were not adjusted.
- 1. Lenzi J, Avaldi VM, Rucci P, Pieri G, Fantini MP. Burden of multimorbidity in relation to age, gender and immigrant status: a cross-sectional study based on administrative data. BMJ Open 2016;6:e012812.ArticlePubMedPMC
- 2. Tugwell P, Knottnerus JA. Multimorbidity and comorbidity are now separate MESH headings. J Clin Epidemiol 2019;105:vi-viii.ArticlePubMed
- 3. Benziger CP, Roth GA, Moran AE. The Global Burden of Disease Study and the preventable burden of NCD. Glob Heart 2016;11:393-397.ArticlePubMed
- 4. Divo MJ, Martinez CH, Mannino DM. Ageing and the epidemiology of multimorbidity. Eur Respir J 2014;44:1055-1068.ArticlePubMedPMC
- 5. Marengoni A, Angleman S, Melis R, Mangialasche F, Karp A, Garmen A, et al. Aging with multimorbidity: a systematic review of the literature. Ageing Res Rev 2011;10:430-439.ArticlePubMed
- 6. Brilleman SL, Purdy S, Salisbury C, Windmeijer F, Gravelle H, Hollinghurst S. Implications of comorbidity for primary care costs in the UK: a retrospective observational study. Br J Gen Pract 2013;63:e274-e282.ArticlePubMedPMC
- 7. Global Burden of Disease Study 2013 Collaborators. Global, regional, and national incidence, prevalence, and years lived with disability for 301 acute and chronic diseases and injuries in 188 countries, 1990-2013: a systematic analysis for the Global Burden of Disease Study 2013. Lancet 2015;386:743-800.PubMedPMC
- 8. Ward BW, Schiller JS. Prevalence of multiple chronic conditions among US adults: estimates from the National Health Interview Survey, 2010. Prev Chronic Dis 2013;10:E65.ArticlePubMedPMC
- 9. Tinetti ME, McAvay G, Trentalange M, Cohen AB, Allore HG. Association between guideline recommended drugs and death in older adults with multiple chronic conditions: population based cohort study. BMJ 2015;351:h4984.ArticlePubMedPMC
- 10. Curtin LR, Mohadjer LK, Dohrmann SM, Kruszon-Moran D, Mirel LB, Carroll MD, et al. National Health and Nutrition Examination Survey: sample design, 2007-2010. Vital Health Stat 2 2013;1-23.
- 11. Zhang N, Yang X, Zhu X, Zhao B, Huang T, Ji Q. Type 2 diabetes mellitus unawareness, prevalence, trends and risk factors: National Health and Nutrition Examination Survey (NHANES) 1999-2010. J Int Med Res 2017;45:594-609.ArticlePubMedPMCPDF
- 12. Al-Ibrahim AA, Jackson RT. Healthy eating index versus alternate healthy index in relation to diabetes status and health markers in U.S. adults: NHANES 2007-2010. Nutr J 2019;18:26.ArticlePubMedPMCPDF
- 13. Miao H, Liu Y, Tsai TC, Schwartz J, Ji JS. Association between blood lead level and uncontrolled hypertension in the US population (NHANES 1999-2016). J Am Heart Assoc 2020;9:e015533.ArticlePubMedPMC
- 14. Hanmer J, Yu L, Li J, Kavalieratos D, Peterson L, Hess R. The diagnosis of asymptomatic disease is associated with fewer healthy days: a cross sectional analysis from the national health and nutrition examination survey. Br J Health Psychol 2019;24:88-101.ArticlePubMedPMCPDF
- 15. Funk LM, Shan Y, Voils CI, Kloke J, Hanrahan LP. Electronic health record data versus the National Health and Nutrition Examination Survey (NHANES): a comparison of overweight and obesity rates. Med Care 2017;55:598-605.PubMedPMC
- 16. Chang HJ, Lin KR, Lin MT, Chang JL. Associations between lifestyle factors and reduced kidney function in US older adults: NHANES 1999-2016. Int J Public Health 2021;66:1603966.ArticlePubMedPMC
- 17. Booth JN 3rd, Li J, Zhang L, Chen L, Muntner P, Egan B. Trends in prehypertension and hypertension risk factors in US adults: 1999-2012. Hypertension 2017;70:275-284.ArticlePubMedPMC
- 18. Szlejf C, Farfel JM, Curiati JA, Couto Ede B Jr, Jacob-Filho W, Azevedo RS. Medical adverse events in elderly hospitalized patients: a prospective study. Clinics (Sao Paulo) 2012;67:1247-1252.ArticlePubMedPMC
- 19. Assimakopoulos K, Karaivazoglou K, Tsermpini EE, Diamantopoulou G, Triantos C. Quality of life in patients with nonalcoholic fatty liver disease: a systematic review. J Psychosom Res 2018;112:73-80.ArticlePubMed
- 20. Lynch CP, Gebregziabher M, Axon RN, Hunt KE, Payne E, Egede LE. Geographic and racial/ethnic variations in patterns of multimorbidity burden in patients with type 2 diabetes. J Gen Intern Med 2015;30:25-32.ArticlePubMedPMCPDF
- 21. National Guideline Centre (UK). Multimorbidity: assessment, prioritisation and management of care for people with commonly occurring multimorbidity. London: National Institute for Health and Care Excellence (NICE); 2016. PMID: 27683922.
- 22. Feely A, Lix LM, Reimer K. Estimating multimorbidity prevalence with the Canadian Chronic Disease Surveillance System. Health Promot Chronic Dis Prev Can 2017;37:215-222.ArticlePubMedPMC
- 23. He Z, Bian J, Carretta HJ, Lee J, Hogan WR, Shenkman E, et al. Prevalence of multiple chronic conditions among older adults in Florida and the United States: comparative analysis of the One-Florida data trust and national inpatient sample. J Med Internet Res 2018;20:e137.ArticlePubMedPMC
- 24. Jamerson K, Weber MA, Bakris GL, Dahlöf B, Pitt B, Shi V, et al. Benazepril plus amlodipine or hydrochlorothiazide for hypertension in high-risk patients. N Engl J Med 2008;359:2417-2428.ArticlePubMed
- 25. Ivanovic B, Tadic M. Hypercholesterolemia and hypertension: two sides of the same coin. Am J Cardiovasc Drugs 2015;15:403-414.ArticlePubMedPDF
- 26. NCD Risk Factor Collaboration (NCD-RisC). Trends in adult body-mass index in 200 countries from 1975 to 2014: a pooled analysis of 1698 population-based measurement studies with 19· 2 million participants. Lancet 2016;387:1377-1396.ArticlePubMedPMC
- 27. Hall JE, do Carmo JM, da Silva AA, Wang Z, Hall ME. Obesityinduced hypertension: interaction of neurohumoral and renal mechanisms. Circ Res 2015;116:991-1006.ArticlePubMedPMC
- 28. Klop B, Elte JW, Cabezas MC. Dyslipidemia in obesity: mechanisms and potential targets. Nutrients 2013;5:1218-1240.ArticlePubMedPMC
- 29. Berg AH, Scherer PE. Adipose tissue, inflammation, and cardiovascular disease. Circ Res 2005;96:939-949.ArticlePubMed
- 30. van Breukelen-van der Stoep DF, van Zeben D, Klop B, van de Geijn GJ, Janssen HJ, van der Meulen N, et al. Marked underdiagnosis and undertreatment of hypertension and hypercholesterolaemia in rheumatoid arthritis. Rheumatology (Oxford) 2016;55:1210-1216.ArticlePubMed
- 31. Marlow EC, Jemal A, Thomson B, Wiese D, Zhao J, Siegel RL, et al. Mortality by education before and during the COVID-19 pandemic, U.S., 2017-2020. Am J Prev Med 2023;64:105-116.ArticlePubMedPMC
- 32. Feyman Y, Avila CJ, Auty S, Mulugeta M, Strombotne K, Legler A, et al. Racial and ethnic disparities in excess mortality among U.S. veterans during the COVID-19 pandemic. Health Serv Res 2022;doi: https://doi.org/10.1111/1475-6773.14112.Article
 PubReader
 ePub Link
 Cite
Cite