Articles
- Page Path
- HOME > Epidemiol Health > Volume 44; 2022 > Article
-
Original Article
Age-specific effects of ozone on pneumonia in Korean children and adolescents: a nationwide time-series study -
Kyoung-Nam Kim1
 , Youn-Hee Lim2, Sanghyuk Bae3, In Gyu Song4, Soontae Kim5, Yun-Chul Hong6,7,8
 -
Epidemiol Health 2021;44:e2022002.
DOI: https://doi.org/10.4178/epih.e2022002
Published online: December 28, 2021
1Department of Preventive Medicine and Public Health, Ajou University School of Medicine, Suwon, Korea
2Department of Public Health, University of Copenhagen, Copenhagen, Denmark
3Department of Preventive Medicine, College of Medicine, The Catholic University of Korea, Seoul, Korea
4Department of Pediatrics, Korea University Guro Hospital, Seoul, Korea
5Department of Environmental and Safety Engineering, Ajou University, Suwon, Korea
6Department of Preventive Medicine, Seoul National University College of Medicine, Seoul, Korea
7Institute of Public Health and Medical Care, Seoul National University Hospital, Seoul, Korea
8Institute of Environmental Medicine, Seoul National University Medical Research Center, Seoul, Korea
- Correspondence: Yun-Chul Hong Department of Preventive Medicine, Seoul National University College of Medicine, 103 Daehak-ro, Jongno-gu, Seoul 03080, Korea E-mail: ychong1@snu.ac.kr
©2022, Korean Society of Epidemiology
This is an open-access article distributed under the terms of the Creative Commons Attribution License (http://creativecommons.org/licenses/by/4.0/), which permits unrestricted use, distribution, and reproduction in any medium, provided the original work is properly cited.
Abstract
-
OBJECTIVES
- The aim of this study was to estimate the age-specific effects of 8-hour maximum ozone levels on pneumonia in children and adolescents.
-
METHODS
- We performed quasi-Poisson regression analyses for individuals of 0-4 years, 5-9 years, 10-14 years, and 15-19 years of age using nationwide time-series data from the Korea (2011-2015). We constructed distributed lag linear models employing a generalized difference-in-differences method and controlling for other air pollutants.
-
RESULTS
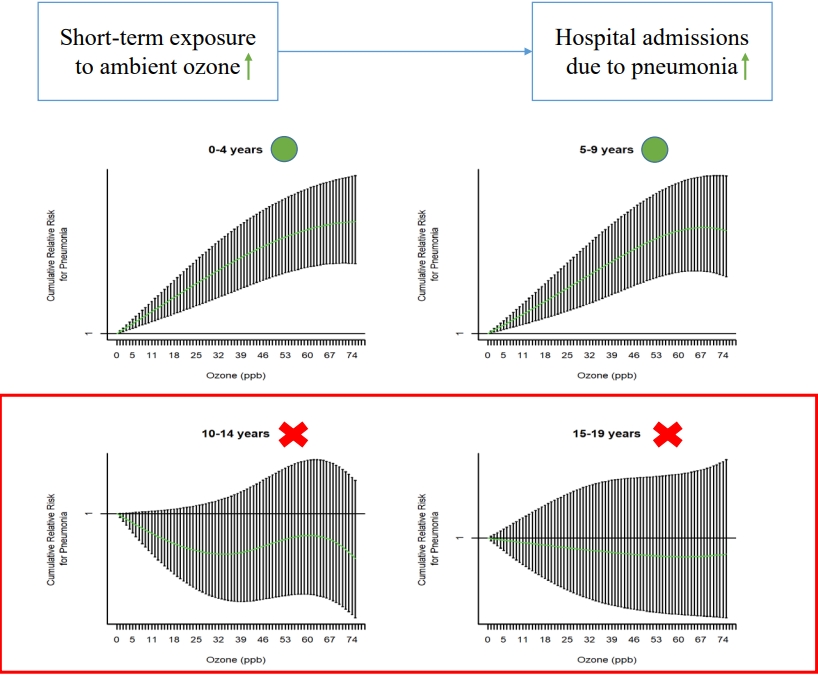
- A 10.0-parts per billion increase in 8-hour maximum ozone levels was associated with a higher risk of hospital admissions due to pneumonia at 0-4 (relative risk [RR], 1.02; 95% confidence interval [CI], 1.01 to 1.03) and 5-9 years of age (RR, 1.06; 95% CI, 1.04 to 1.08), but not at 10-14 (RR, 1.01; 95% CI, 0.98 to 1.04) or 15-19 years of age (RR, 1.01; 95% CI, 0.97 to 1.06). The association between ozone and hospital admissions due to pneumonia was stronger in cool seasons (from November to April) than in warm seasons (from May to October), but was similar between boys and girls.
-
CONCLUSIONS
- Short-term exposure to ozone was associated with a higher risk of pneumonia at 0-4 years and 5-9 years of age, but not at 10-14 years or 15-19 years of age. Our findings can help identify vulnerable periods, determine the target populations for public health interventions, and establish air pollution standards.
- Ambient ozone, an air pollutant, is a global public health issue. Ozone has strong oxidative potential and has been associated with various health outcomes, such as airway inflammation [1], decreased lung function [2], hospital admission due to respiratory diseases [3], and mortality [4]. Because ozone is primarily generated from photochemical reactions of other air pollutants under high temperatures and sunlight, ozone levels are predicted to rise globally due to climate change [5].
- Previous experimental studies have suggested that ozone can increase the susceptibility to respiratory infections, such as pneumonia [6,7]. However, the number of epidemiological studies on the association between ozone and pneumonia is insufficient compared with that of studies investigating the association between other pollutants (e.g., particulate matter with an aerodynamic diameter ≤ 2.5 µm [PM2.5]) and pneumonia, and their results are inconsistent [8-15]. For example, short-term exposure to ozone has been associated with a higher risk of pneumonia in time-series studies conducted in the United States [9] and China [8], while an association was not found in a case-crossover study in the United States [10]. In addition, although previous studies have suggested that there may be an effect modification by age on the association between ozone and pneumonia [8,9], and that children and adolescents may be especially susceptible to air pollution [16], evidence for these younger populations is limited [9,11-14].
- Therefore, using nationwide time-series data of Korean children and adolescents, we investigated the association between ozone exposure and pneumonia, which represents the most common cause of hospitalization among individuals under 18 years of age [17] and the second most expensive condition for hospitalization among children [18]. We hypothesized that the effect size would be larger among younger than older subjects, and we therefore performed analyses stratified by age group and compared the results in each stratum.
INTRODUCTION
- Patient and hospital admission data
- We performed a time-series study using data on daily counts of hospital admissions with a principal admission diagnosis of pneumonia (International Classification of Diseases, 10th revision code J12-J18) among children and adolescents (0-19 years of age) between January 1, 2011 and December 31, 2015. We obtained data from the National Health Insurance Service (NHIS) of Korea, which provides universal health coverage to all residents of Korea [19]. In this study, the NHIS generated and provided data by aggregating the count of only the first day of admission for each hospitalization. The accuracy of diagnoses in the NHIS data has been previously reported to be high, especially for inpatient settings [20-23]. The outcome daily counts were aggregated by region (16 regions constituting of Korea) (Supplementary Material 1), age group (0-4, 5-9, 10-14, and 15-19 years), and sex, leading to 128 separate timeseries data sets.
- Air pollution and meteorological data
- We estimated 8-hour maximum ozone concentrations (highest 8-hour moving average concentration) and daily mean concentrations of particulate matter with an aerodynamic diameter ≤ 10 µm (PM10), nitrogen dioxide (NO2), sulfur dioxide (SO2), and carbon monoxide (CO) in each region from the 24-hour monitoring data of urban monitoring stations. We obtained this data from the National Ambient Air Monitoring Information System. This national system continuously collects data from 318 fixed-site monitoring stations, which are located based on the population distribution and operated under strict quality control [24]. We first calculated 8-hour maximum ozone levels and daily mean PM10, NO2, SO2, and CO levels at each monitoring station after excluding missing values (< 5% of total data). We then calculated region-specific values by averaging 8-hour maximum ozone levels and daily mean PM10, NO2, SO2, and CO levels from all monitoring stations located in each region. Because nationwide monitoring of PM2.5 was not conducted during the study period (2011-2015), we did not consider PM2.5 levels in the present study.
- We estimated daily mean temperature (°C) and relative humidity (%) for each region using 24-hour measurement data from the Korea National Meteorological Administration. If there were multiple weather stations in a region, we used average temperature and relative humidity values for further analyses.
- Statistical analysis
- We performed quasi-Poisson generalized linear regression analyses to evaluate the short-term effects of 8-hour maximum ozone levels on hospital admissions due to pneumonia. All further analyses were performed using data stratified by the age groups of 0-4 years, 5-9 years, 10-14 years, and 15-19 years.
- To assess the delayed and cumulative effects of lag-day exposures, we constructed distributed lag linear models [25]. In these models, we implemented lag structures up to 7 days with a polynomial function with 4 degrees of freedom, according to previous studies investigating the association between short-term exposure to ozone levels and respiratory infection-related outcomes [9,11] and the lag-specific associations between ozone and pneumonia estimated from distributed lag linear models (adjusted for region, day, temperature, relative humidity, population, and other air pollutants) (Supplementary Material 2). We selected the degrees of freedom according to a previous study [26]. However, we also confirmed the robustness of the results in models with different degrees of freedom in sensitivity analyses.
- To improve causal inference by adjusting for confounders related to spatial units of the analysis (i.e., regions) and those related to temporal units (i.e., days), we employed a generalized differencein-differences method [27,28], a formal causal modeling approach [27], by introducing dummy variables for spatial units (16 regions) and temporal units (1,826 days) in the time-series analytical models. The common form of the difference-in-differences method leverages 2 areas (or exposures) and 2 time points. However, the difference-in-differences method can be applied to data with multiple spatial and temporal units by examining the association between the exposure and outcome of interest (both measured at the level of a predefined spatial and temporal unit) adjusted for spatial and temporal units [29,30]; therefore, in the context of short-term air pollution epidemiology, it can be applied as a multi-region time-series study adjusted for spatial (e.g., regions) and temporal units (e.g., days). This method can control for both measured and unmeasured confounders, such as socio-demographic factors [27,28]. Therefore, although this method is computationally demanding, it has an edge over other causal inference methods, such as those using a propensity score, which can only control for measured confounders.
- We also adjusted for daily mean temperature and relative humidity up to 7 days, all of which were modeled with a natural cubic spline with 3 degrees of freedom according to previous studies [8,11], and the log-transformed population of each region as an offset. Finally, to confirm that the results were not confounded by other air pollutants, we further adjusted the analyses for daily mean PM10, NO2, SO2, and CO levels up to 7 days. Therefore, the main analytical models from which we extracted the main findings can be summarized as follows:
- where Ys,t is the number of hospital admissions due to pneumonia in region s on day t; Ozones,t, Temps,t, Humis,t, and Polluts,t are the cross-basis matrices of ozone, temperature, relative humidity, and other air pollutants (PM10, NO2, SO2, and CO), respectively, in region s on day t with the aforementioned lag structures and concentration-response curves; Ds and Dt are dummy variables for regions and days, respectively; and Pops,t is the population of region s in the year of day t. All variance inflation factors estimated from quasi-Poisson regression models including terms for daily 8-hour maximum ozone levels and daily mean levels of PM10, NO2, SO2, CO, temperature, and relative humidity were lower than 4.0 in the age groups of 0-4 years, 5-9 years, 10-14 years, and 15-19 years of age. In addition, the shapes of the concentration-response curves for the associations between ozone and pneumonia at 0-4 years, 5-9 years, 10-14 years, and 15-19 years of age were investigated using distributed lag non-linear models adjusted for the same covariates (the concentration-response curves were modeled with a natural cubic spline with 3 degrees of freedom).
- Because several studies have suggested heterogeneity of the association between ozone levels and pneumonia by seasons [8,10], we stratified the analyses according to warm seasons (from May to October) and cool seasons (from November to April). We also performed sex-stratified analyses to assess the associations’ similarity between boys and girls.
- We conducted the following sensitivity analyses: First, we repeated the analyses after excluding the region with the lowest ozone levels (Seoul, 28.1 parts per billion [ppb]) and the one with the highest levels (Jeju Province, 41.6 ppb), to verify possible violations of the positivity assumption [31]. The positivity assumption, which is essential for causal inference, postulates that each exposure level (or intervention and control) could be observable at each observation. In this study, it was likely that some ozone levels would not be observed in the regions with the highest and lowest ozone levels, in which case there was a concern that causal inference could not be adequately made in these regions. Second, according to previous studies [9-12], we further adjusted for influenza epidemics, defined as a daily number of hospital admissions due to influenza of more than 80 cases in each region (1.0% of the study period). Third, we used different degrees of freedom for the lag structures (2 to 5 degrees of freedom) and concentration-response curves (2 to 5 degrees of freedom) in the distributed lag linear models. Fourth, we conducted conventional 2-stage time-series analyses to confirm the robustness of the results. In these analyses, we first obtained region-specific associations between ozone levels and pneumonia adjusted for calendar time (natural cubic spline, 8 degrees of freedom per year), daily mean temperature and relative humidity up to 7 days (cross-basis matrices, 3 degrees of freedom), and other pollutants (PM10, NO2, SO2, and CO) up to 7 days (cross-basis matrices). We then pooled the region-specific results by performing meta-analyses.
- We conducted the analyses using R version 4.0.3 (R Foundation for Statistical Computing, Vienna, Austria).
- Ethics statement
- Because we used secondary count data de-identified by the NHIS, the need for written informed consent was waived. The Ethics Review Board of Seoul National University Hospital approved the study protocol (approval No. E-1909-096-1065), and we performed the study according to the tenets of the Declaration of Helsinki.
MATERIALS AND METHODS
- The mean± standard deviation daily counts of hospital admissions due to pneumonia during the study period (2011-2015) were 493± 276 at 0-4 years of age, 100± 90 at 5-9 years of age, 29± 26 at 10-14 years of age, and 12± 10 at 15-19 years of age (Table 1). The daily counts of hospital admissions due to pneumonia were higher in cool than in warm seasons (Supplementary Material 3). The mean 7-day moving average of the daily 8-hour maximum ozone levels during the study period was 37.3 ppb, which is comparable to the levels in the United States and other developed countries (Table 1) [32]. The ozone levels were higher in warm than in cool seasons, while PM10, NO2, SO2, and CO levels were higher in cool than in warm seasons (Supplementary Material 3).
- The correlations of ozone levels with other air pollutant levels and meteorological factors were weak, with the absolute values of Spearman correlation coefficients less than 0.30, except for the correlation between ozone levels and temperature (r= 0.43, p< 0.001) (Supplementary Material 4).
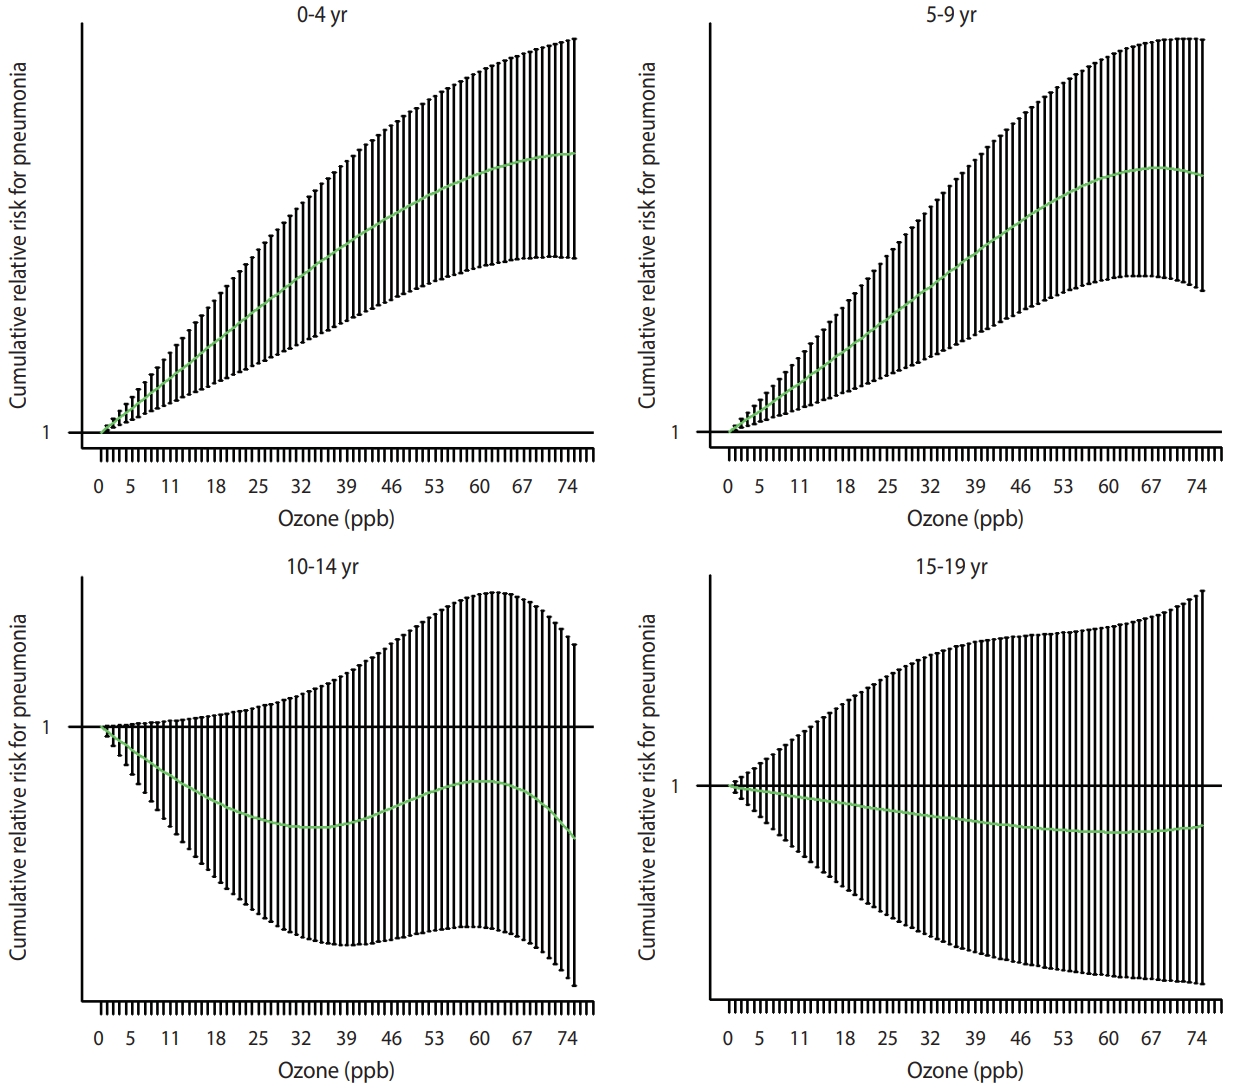
- After a visual inspection of the concentration-response curves for the associations between ozone levels and pneumonia (Figure 1), we estimated the delayed and cumulative effects of ozone levels up to 7 days on pneumonia using the distributed lag linear models. A 10.0-ppb increase in ozone levels was associated with a higher risk of pneumonia at 0-4 (relative risk [RR], 1.02; 95% confidence interval [CI], 1.01 to 1.03) and 5-9 years of age (RR, 1.06; 95% CI, 1.04 to 1.08), but not at 10-14 (RR, 1.01; 95% CI, 0.98 to 1.04) or 15-19 years of age (RR, 1.01; 95% CI, 0.97 to 1.06) (Table 2).
- Using the same analytical models, we also found positive associations of a 10.0-µg/m3 increase in PM10 (RR, 1.01; 95% CI, 1.00 to 1.02) and a 1.0-ppb increase in SO2 (RR, 1.01; 95% CI: 1.00 to 1.01) with pneumonia at 0-4 years of age; however, in other age groups, the associations between air pollutant levels and pneumonia were generally null or inverse, except for the association with CO (Supplementary Material 5).
- When we stratified the analyses by season, the association between ozone and pneumonia was stronger in cool seasons (from November to April) than in warm seasons (from May to October) (Table 2). However, we found no appreciable sex differences in the association between ozone and pneumonia (Supplementary Material 6).
- We conducted sensitivity analyses using alternative data, covariate selections, and model specifications. First, the results were insensitive to the exclusion of the region with the lowest ozone levels (Supplementary Material 7) and the region with the highest ozone levels (Supplementary Material 8). Second, after further adjusting for influenza epidemics, the results did not change appreciably (Supplementary Material 9). Third, we found robust results using different degrees of freedom for the lag structures and concentration-response curves (data not shown). Fourth, the results were consistent between conventional 2-stage time-series analyses and the analyses applying the difference-in-differences method, except that the association at 5-9 years of age was only found in the difference-in-differences approach. This heterogeneity might be due to strict control of potential confounders (related to spatial and temporal units) by the difference-in-differences method (Supplementary Material 10).
RESULTS
- The ozone levels in Korea, as presented in this study, were comparable to those in the United States and other developed countries. We found that ozone levels were associated with a higher risk of hospital admissions due to pneumonia at 0-4 years and 5-9 years of age, but not at 10-14 years or 15-19 years of age, in the formal causal inference models. Because the socioeconomic burden of pneumonia in children and adolescents is high [17,18] and air pollution may increase the associated costs [33], the results of the present study have substantial public health implications.
- Previous studies exploring the association between ozone exposure and pneumonia among children and adolescents are relatively rare and have yielded heterogeneous results [12]. For example, a time-series study conducted in 17 states of the United States reported a positive association between ozone levels and emergency department visits due to pneumonia at 0-18 years of age [9], while another time-series study in Hanoi, Vietnam did not find an association between ozone levels and hospital admissions due to pneumonia at 0-17 years of age [11]. Furthermore, few studies have identified high-risk age groups by stratifying children and adolescents by age: Some studies suggested that associations between ozone and pneumonia might be more prominent at 0-4 years of age than at older ages [13,14]. However, another time-series study failed to identify an association between ozone and pneumonia at 0-1 years and 1-5 years of age [11]. For older children and adolescents, a case-crossover study in California found no association between ozone levels and emergency department visits due to pneumonia at 5-18 years of age [13]. This observed heterogeneity may be attributable to differences in population characteristics (related, for example, to sensitivity and adaptive capacity), exposure levels, measurement error for exposure and outcome, and analytical strategies (e.g., study design, statistical models, and methods used to control for the confounding effects of various factors, including other air pollutants).
- In the generalized difference-in-differences analyses, considering the effects of other air pollutants, we found an association between ozone levels and pneumonia at 0-4 years and 5-9 years of age, but not at 10-14 years or 15-19 years of age. It has been suggested that ozone exposure can increase the risk of airway infections by affecting host immunity [34,35]. Thus, the immature immune system of younger children may explain these findings [36]. The results might also reflect lower rates of outdoor activity (and time spent outdoors) among middle-school and high-school students compared with those of younger children in Korea [37], given that indoor ozone levels are generally lower than outdoor levels [15].
- Most previous studies [8,10,11,13,15], but not all of them [14], have reported a stronger association between ozone and pneumonia in warm than in cool seasons. These findings are inconsistent with the results of this study, which showed a stronger association in cool seasons. The reason for this inconsistency is not clear. However, although ambient ozone levels are lower in cool seasons, outdoor activities are likely to increase on sunny days with higher temperatures (possibly days with higher ozone levels as well) in cool seasons but decrease on similar days in warm seasons, resulting in different individual exposure patterns according to seasons [14]. In addition, air conditioning with low ventilation due to closed windows in warm seasons (especially on sunny days with higher temperatures) can also prevent the penetration of outdoor ozone, hence reducing exposure [15]. Finally, the observed stronger association between ozone and pneumonia in cool seasons might be affected by seasonal differences in ozone levels and their variance (Supplementary Material 3) or the unmeasured confounding effect of seasonal variations in infections. However, we found robust results in analyses further adjusted for influenza epidemics.
- This study has limitations. First, we used monitoring data for ozone levels from fixed sites as a proxy for population exposure. Although this exposure assignment method is widely used in air pollution epidemiology studies (especially those exploring the effects of short-term exposure to air pollution) and ozone levels are spatially homogeneous compared with the levels of other air pollutants [38], it reportedly produces the Berkson-type measurement error, leading to lower precision rather than to bias [39]. Second, outcome misclassification is a concern. However, because we defined the outcome based on the principal diagnosis of hospital admission due to pneumonia determined by a physician, problems related to the precision of the diagnosis can be assumed to be low. In contrast, as we only analyzed relatively severe cases leading to hospital admission, it remains possible that the association between ozone and pneumonia would be attenuated after including relatively mild cases. Third, although negative control outcomes can be used to detect bias and strengthen causal inference using an observational study design [40], we could not apply them (e.g., hospital admissions due to appendicitis) in the present study, due to the lack of sufficient information. Fourth, this study used all hospitalization cases, rather than hospitalizations only through the emergency room, as an outcome; therefore, a considerable proportion of hospitalizations might have been scheduled and not associated with ozone exposure, leading the results toward the null hypothesis.
- However, the present study has strengths that merit highlighting. First, this is one of a few studies that systematically evaluated the susceptible periods to ozone exposure regarding pneumonia among children and adolescents, who are considered vulnerable populations. Therefore, this study provides valuable evidence to select priority target populations for public health interventions and policies. Second, because the present study included all cases of hospital admissions due to pneumonia among children and adolescents in Korea during the study period (2011-2015), the possibility of selection bias is low. Third, to the best of our knowledge, this is the first study to apply a formal causal inference method to investigate the effect of ozone levels on pneumonia. Using a generalized difference-in-differences method, we could control for a wide range of confounders related to the spatial and temporal units of the study, thus substantially improving causal inference. Fourth, we assessed the independent effect of ozone on pneumonia by considering other air pollutants that can act as confounders. These analyses not only provide stronger evidence for a causal relationship, but also have direct public health implications, by aiding the formulation of air pollution standards for a specific air pollutant.
- In conclusion, ozone levels were associated with a higher risk of pneumonia at 0-4 years and 5-9 years of age, but not at 10-14 years or 15-19 years of age. This study provides valuable insights to help identify vulnerable periods to ozone exposure in terms of pneumonia, determine the target populations for public health interventions and policies, and establish air pollution standards (considering the observed association between ozone and pneumonia below the current ozone standards). However, because the results of the present study might also reflect differences in outdoor activity patterns by age groups as well as vulnerability, future studies involving a more precise estimation of ozone exposure considering behavioral factors are needed.
DISCUSSION
SUPPLEMENTARY MATERIALS
Supplementary Material 1.
Supplementary Material 2.
Supplementary Material 3.
Supplementary Material 4.
Supplementary Material 5.
Supplementary Material 6.
Supplementary Material 7.
Supplementary Material 8.
Supplementary Material 9.
Supplementary Material 10.
-
CONFLICT OF INTEREST
The authors have no conflicts of interest to declare for this study.
-
FUNDING
This study was supported by the Basic Science Research Program of the National Research Foundation (NRF) funded by the Ministry of Science and ICT of the Republic of Korea (grant No. NRF-2017R1E1A1A03071123). Fine particle modeling was conducted via the National Strategic Project-Fine Particle of the NRF funded by the Ministry of Science and ICT, the Ministry of Environment, and the Ministry of Health and Welfare of the Republic of Korea (grant No. NRF-2017M3D8A1092008 and NRF-2017 M3D8A1092009).
-
AUTHOR CONTRIBUTIONS
Conceptualization: Kim KN, Lim YH, Bae S, Song IG, Kim S, Hong YC. Data curation: Kim KN. Formal analysis: Kim KN. Funding acquisition: Hong YC. Methodology: Lim YH, Bae S, Song IG, Kim S. Project administration: Hong YC. Visualization: Kim KN. Writing – original draft: Kim KN. Writing – review & editing: Lim YH, Bae S, Song IG, Kim S, Hong YC.
NOTES
ACKNOWLEDGEMENTS

| Variables | Mean±SD |
Percentile |
IQR | ||||
|---|---|---|---|---|---|---|---|
| Min | 25th | 50th | 75th | Max | |||
| Age (yr) | |||||||
| 0-4 | 493±276 | 88 | 295 | 424 | 633 | 2,507 | 338 |
| 5-9 | 100±90 | 6 | 46 | 70 | 114 | 726 | 68 |
| 10-14 | 29±26 | 0 | 12 | 21 | 35 | 274 | 23 |
| 15-19 | 12±10 | 0 | 6 | 10 | 15 | 117 | 9 |
| Air pollution levels | |||||||
| Ozone (ppb)1 | 37.3±13.4 | 6.8 | 26.8 | 36.5 | 46.7 | 90.3 | 19.9 |
| PM10 (µg/m3)2 | 46.4±17.4 | 11.6 | 34.4 | 43.6 | 54.9 | 203.0 | 20.6 |
| NO2 (ppb)2 | 20.7±8.9 | 2.5 | 14.2 | 19.2 | 25.7 | 63.3 | 11.6 |
| SO2 (ppb)2 | 4.8±2.0 | 1.0 | 3.3 | 4.6 | 6.0 | 17.3 | 2.6 |
| CO (ppb)2 | 496.0±150.3 | 172.3 | 394.9 | 469.9 | 568.8 | 1,502.0 | 173.9 |
| Meteorological factors3 | |||||||
| Temperature (°C) | 13.2±9.8 | -14.6 | 4.8 | 14.4 | 21.7 | 33.1 | 16.9 |
| Relative humidity (%) | 67.0±15.2 | 11.3 | 56.8 | 68.5 | 78.3 | 99.9 | 21.5 |
SD, standard deviation; IQR, interquartile range; PM10, particulate matter with an aerodynamic diameter ≤10 μm; NO2, nitrogen dioxide; SO2, sulfur dioxide; CO, carbon monoxide; ppb, parts per billion.
1 Distribution of 7-day moving averages of daily 8-hour maximum concentrations during the study period (2011-2015).
2 Distribution of 7-day moving averages of daily mean concentrations during the study period (2011-2015).
3 Distribution of daily averages during the study period (2011-2015).
| Age (yr) |
Other air pollutants2 |
Season |
||
|---|---|---|---|---|
| Crude | Adjusted | Warm (from May to October) | Cool (from November to April) | |
| 0-4 | 1.02 (1.01, 1.03) | 1.02 (1.01, 1.03) | 1.01 (0.99, 1.02) | 1.06 (1.04, 1.09) |
| 5-9 | 1.06 (1.04, 1.08) | 1.06 (1.04, 1.08) | 1.05 (1.02, 1.07) | 1.07 (1.03, 1.12) |
| 10-14 | 1.02 (0.99, 1.05) | 1.01 (0.98, 1.04) | 1.03 (0.99, 1.07) | 0.95 (0.88, 1.02) |
| 15-19 | 1.01 (0.97, 1.06) | 1.01 (0.97, 1.06) | 1.01 (0.96, 1.07) | 1.09 (0.98, 1.20) |
Values are presented as relative risk (95% confidence interval).
ppb, parts per billion; PM10, particulate matter with an aerodynamic diameter ≤10 μm; NO2, nitrogen dioxide; SO2, sulfur dioxide; CO, carbon monoxide.
1 Cumulative effects were estimated for a 10.0-ppb increase in ozone levels, after adjustment for region, day, temperature, relative humidity, and population (and PM10, NO2, SO2, and CO in models further adjusted for other air pollutants).
2 PM10, NO2, SO2, and CO.
- 1. Mumby S, Chung KF, Adcock IM. Transcriptional effects of ozone and impact on airway inflammation. Front Immunol 2019;10:1610.ArticlePubMedPMC
- 2. Dimakopoulou K, Douros J, Samoli E, Karakatsani A, Rodopoulou S, Papakosta D, et al. Long-term exposure to ozone and children’s respiratory health: results from the RESPOZE study. Environ Res 2020;182:109002.ArticlePubMed
- 3. Ji M, Cohan DS, Bell ML. Meta-analysis of the association between short-term exposure to ambient ozone and respiratory hospital admissions. Environ Res Lett 2011;6:024006.ArticlePubMedPMC
- 4. Orellano P, Reynoso J, Quaranta N, Bardach A, Ciapponi A. Shortterm exposure to particulate matter (PM10 and PM2.5), nitrogen dioxide (NO2), and ozone (O3) and all-cause and cause-specific mortality: systematic review and meta-analysis. Environ Int 2020;142:105876.ArticlePubMed
- 5. Aaron-Morrison AP, Ackerman SA, Adams NG, Adler RF, Albanil A, Alfaro EJ, et al. State of the climate in 2014. Bull Am Meteorol Soc 2015;96:S1-S267.
- 6. Kesic MJ, Meyer M, Bauer R, Jaspers I. Exposure to ozone modulates human airway protease/antiprotease balance contributing to increased influenza A infection. PLoS One 2012;7:e35108.ArticlePubMedPMC
- 7. Mikerov AN, Haque R, Gan X, Guo X, Phelps DS, Floros J. Ablation of SP-A has a negative impact on the susceptibility of mice to Klebsiella pneumoniae infection after ozone exposure: sex differences. Respir Res 2008;9:77.ArticlePubMedPMC
- 8. Tian Y, Wu Y, Liu H, Si Y, Wu Y, Wang X, et al. The impact of ambient ozone pollution on pneumonia: a nationwide time-series analysis. Environ Int 2020;136:105498.ArticlePubMed
- 9. Strosnider HM, Chang HH, Darrow LA, Liu Y, Vaidyanathan A, Strickland MJ. Age-specific associations of ozone and fine particulate matter with respiratory emergency department visits in the United States. Am J Respir Crit Care Med 2019;199:882-890.ArticlePubMed
- 10. Pirozzi CS, Jones BE, VanDerslice JA, Zhang Y, Paine R 3rd, Dean NC. Short-term air pollution and incident pneumonia. a case-crossover study. Ann Am Thorac Soc 2018;15:449-459.ArticlePubMed
- 11. Nhung NT, Schindler C, Dien TM, Probst-Hensch N, Perez L, Künzli N. Acute effects of ambient air pollution on lower respiratory infections in Hanoi children: an eight-year time series study. Environ Int 2018;110:139-148.ArticlePubMed
- 12. Nhung NT, Amini H, Schindler C, Kutlar Joss M, Dien TM, Probst-Hensch N, et al. Short-term association between ambient air pollution and pneumonia in children: a systematic review and meta-analysis of time-series and case-crossover studies. Environ Pollut 2017;230:1000-1008.ArticlePubMed
- 13. Malig BJ, Pearson DL, Chang YB, Broadwin R, Basu R, Green RS, et al. A time-stratified case-crossover study of ambient ozone exposure and emergency department visits for specific respiratory diagnoses in California (2005-2008). Environ Health Perspect 2016;124:745-753.ArticlePubMed
- 14. Darrow LA, Klein M, Flanders WD, Mulholland JA, Tolbert PE, Strickland MJ. Air pollution and acute respiratory infections among children 0-4 years of age: an 18-year time-series study. Am J Epidemiol 2014;180:968-977.ArticlePubMedPMC
- 15. Medina-Ramón M, Zanobetti A, Schwartz J. The effect of ozone and PM10 on hospital admissions for pneumonia and chronic obstructive pulmonary disease: a national multicity study. Am J Epidemiol 2006;163:579-588.ArticlePubMed
- 16. Lin S, Liu X, Le LH, Hwang SA. Chronic exposure to ambient ozone and asthma hospital admissions among children. Environ Health Perspect 2008;116:1725-1730.ArticlePubMedPMC
- 17. Witt WP, Weiss AJ, Elixhauser A. Overview of hospital stays for children in the United States, 2012: statistical brief #187. In: Healthcare Cost and Utilization Project (HCUP) statistical briefs. Rockville: Agency for Healthcare Research and Quality; 2006. PMID: 25695124.
- 18. Keren R, Luan X, Localio R, Hall M, McLeod L, Dai D, et al. Prioritization of comparative effectiveness research topics in hospital pediatrics. Arch Pediatr Adolesc Med 2012;166:1155-1164.ArticlePubMed
- 19. Song YJ. The South Korean health care system. JMAJ 2009;52:206-209.
- 20. Hwang YJ, Park SM, Ahn S, Lee J, Park YS, Kim N. Diagnostic accuracy of administrative database for bile duct cancer by ICD10 code in a tertiary institute in Korea. Hepatobiliary Pancreat Dis Int 2020;19:575-580.ArticlePubMed
- 21. Kim JA, Yoon S, Kim LY, Kim DS. Towards actualizing the value potential of Korea Health Insurance Review and Assessment (HIRA) data as a resource for health research: strengths, limitations, applications, and strategies for optimal use of HIRA data. J Korean Med Sci 2017;32:718-728.ArticlePubMedPMC
- 22. Park BJ, Sung J, Park K, Seo SW, Kim SH. Studying on diagnosis accuracy for health insurance claims data in Korea. Seoul: Seoul National University; 2003. p 17-29 (Korean).
- 23. Park J, Kwon S, Choi EK, Choi YJ, Lee E, Choe W, et al. Validation of diagnostic codes of major clinical outcomes in a National Health Insurance database. Int J Arrhythm 2019;20:1-7.Article
- 24. AirKorea. Guidelines for installation and operation of air pollution monitoring network; 2016 [cited 2020 Aug 23]. Available from: https://www.airkorea.or.kr/web/board/3/267/?page= 1&pMENU_NO=145 (Korean).
- 25. Gasparrini A. Distributed lag linear and non-linear models in R: the package dlnm. J Stat Softw 2011;43:1-20.
- 26. Kim KN, Kim S, Lim YH, Song IG, Hong YC. Effects of shortterm fine particulate matter exposure on acute respiratory infection in children. Int J Hyg Environ Health 2020;229:113571.ArticlePubMed
- 27. Wang Y, Kloog I, Coull BA, Kosheleva A, Zanobetti A, Schwartz JD. Estimating causal effects of long-term PM2.5 exposure on mortality in New Jersey. Environ Health Perspect 2016;124:1182-1188.ArticlePubMedPMC
- 28. Renzi M, Forastiere F, Schwartz J, Davoli M, Michelozzi P, Stafoggia M. Long-term PM10 exposure and cause-specific mortality in the Latium Region (Italy): a difference-in-differences approach. Environ Health Perspect 2019;127:67004.ArticlePubMed
- 29. Norberg KE, Bierut LJ, Grucza RA. Long-term effects of minimum drinking age laws on past-year alcohol and drug use disorders. Alcohol Clin Exp Res 2009;33:2180-2190.ArticlePubMedPMC
- 30. Du Mouchel W, Williams AF, Zador P. Raising the alcohol purchase age: its effects on fatal motor vehicle crashes in twenty-six states. J Leg Stud 1987;16:249-266.Article
- 31. Westreich D, Cole SR. Invited commentary: positivity in practice. Am J Epidemiol 2010;171:674-677.ArticlePubMedPMC
- 32. United States Environmental Protection Agency. Integrated Science Assessment (ISA) for ozone and related photochemical oxidants; 2015 [cited 2020 Aug 23]. Available from: https://www.epa.gov/isa/integrated-science-assessment-isa-ozone-and-related-photochemical-oxidants.
- 33. Glick AF, Tomopoulos S, Fierman AH, Elixhauser A, Trasande L. Association between outdoor air pollution levels and inpatient outcomes in pediatric pneumonia hospitalizations, 2007 to 2008. Acad Pediatr 2019;19:414-420.ArticlePubMed
- 34. Ciencewicki J, Jaspers I. Air pollution and respiratory viral infection. Inhal Toxicol 2007;19:1135-1146.ArticlePubMed
- 35. Domingo JL, Rovira J. Effects of air pollutants on the transmission and severity of respiratory viral infections. Environ Res 2020;187:109650.ArticlePubMedPMC
- 36. Wang KY, Chau TT. An association between air pollution and daily outpatient visits for respiratory disease in a heavy industry area. PLoS One 2013;8:e75220.ArticlePubMedPMC
- 37. Song Y, Yang HI, Lee EY, Yu MS, Kang MJ, Kang HJ, et al. Results from South Korea’s 2016 report card on physical activity for children and youth. J Phys Act Health 2016;13(11 Suppl 2):S274-S278.ArticlePubMed
- 38. Goldman GT, Mulholland JA, Russell AG, Srivastava A, Strickland MJ, Klein M, et al. Ambient air pollutant measurement error: characterization and impacts in a time-series epidemiologic study in Atlanta. Environ Sci Technol 2010;44:7692-7698.ArticlePubMedPMC
- 39. Wacholder S. When measurement errors correlate with truth: surprising effects of nondifferential misclassification. Epidemiology 1995;6:157-161.ArticlePubMed
- 40. Dusetzina SB, Brookhart MA, Maciejewski ML. Control outcomes and exposures for improving internal validity of nonrandomized studies. Health Serv Res 2015;50:1432-1451.ArticlePubMedPMC
REFERENCES
Figure & Data
References
Citations
- Challenges of Air Pollution and Health in East Asia
Xihao Du, Renjie Chen, Haidong Kan
Current Environmental Health Reports.2024;[Epub] CrossRef - Intraday exposure to ambient ozone and emergency department visits among children: a case-crossover study in southern China
Jiahong Ren, Lifeng Zhu, Yachen Li, Haiyi Li, Qian Hu, Jian Zhu, Qingyan Zhang, Yunquan Zhang
Environmental Science and Pollution Research.2023; 30(30): 74853. CrossRef
 PubReader
 ePub Link
 Cite
Cite