Articles
- Page Path
- HOME > Epidemiol Health > Volume 44; 2022 > Article
-
Original Article
The associations of the national health and productivity management program with corporate profits in Japan -
Yuichiro Yano1,2
 , Hiroshi Kanegae3, Koichi Node4, Atsushi Mizuno5, Akira Nishiyama6, Hiromi Rakugi7, Hiroshi Itoh8, Kaori Kitaoka1, Naoki Kashihara9, Fumiaki Ikeno10, Ichiro Tsuji11, Kunio Okada12
 -
Epidemiol Health 2022;44:e2022080.
DOI: https://doi.org/10.4178/epih.e2022080
Published online: September 23, 2022
1Department of Advanced Epidemiology, Noncommunicable Disease (NCD) Epidemiology Research Center, Shiga University of Medical Science, Otsu, Japan
2Department of Family Medicine and Community Health, Duke University, Durham, NC, USA
3Genki Plaza Medical Center for Health Care, Tokyo, Japan
4Department of Cardiovascular Medicine, Saga University, Saga, Japan
5Department of Cardiology, QI Center, St. Luke’s International Hospital, Tokyo, Japan
6Department of Pharmacology, Faculty of Medicine, Kagawa University, Kagawa, Japan
7Department of Geriatric and General Medicine, Osaka University Graduate School of Medicine, Suita, Japan
8Department of Endocrinology, Metabolism and Nephrology, Keio University School of Medicine, Tokyo, Japan
9Department of Nephrology and Hypertension, Kawasaki Medical School, Kurashiki, Japan
10Division of Cardiovascular Medicine, Department of Medicine, Stanford University School of Medicine, Stanford, CA, USA
11Division of Epidemiology, Department of Health Informatics and Public Health, Graduate School of Medicine, Tohoku University School of Public Health, Miyagi, Japan
12Non-Profit Organization Kenkokeiei, Tokyo, Japan
- Correspondence: Yuichiro Yano Department of Advanced Epidemiology, Noncommunicable Disease (NCD) Epidemiology Research Center, Shiga University of Medical Science, Tukinowa-cho, Otsu-shi, Shiga 520-2192, Japan E-mail: yano.yuichiro@jichi.ac.jp
© 2022, Korean Society of Epidemiology
This is an open-access article distributed under the terms of the Creative Commons Attribution License (http://creativecommons.org/licenses/by/4.0/), which permits unrestricted use, distribution, and reproduction in any medium, provided the original work is properly cited.
Abstract
-
OBJECTIVES
- Using a dataset from a survey on national health and productivity management, we identified health and productivity factors associated with organizational profitability.
-
METHODS
- The Ministry of Economy, Trade and Industry conducted an annual survey on Health and Productivity Management between 2014 and 2021. We assessed the associations of organizational health and productivity management using survey questions collected in 2017 and 2018, with the rate of change in profits from 2017 and 2018 to 2020. We identified factors associated with organizational profitability using eXtreme Gradient Boosting, and calculated SHapley Additive exPlanation (SHAP) values for each factor.
-
RESULTS
- Among 1,593 companies (n= 4,359,834 employees), the mean age of employees at baseline was 40.3 years and the proportion of women was 25.8%. A confusion matrix for evaluating model performance had an accuracy of 0.997, precision of 0.993, recall of 0.997, and area under the precision-recall curve of 0.999. The most important factors related to an increase in corporate profits were the percentage of current smokers (SHAP value, 0.121), per-employee cost of health services (0.084) and medical services (0.050); the percentage of full-time employees working in sales departments (0.074) and distribution or customer service departments (0.054); the percentage of employees who slept well (0.055); and the percentage of employees within a company who regularly exercised (0.043).
-
CONCLUSIONS
- Employees’ lifestyle-related health risk factors and organizations’ management systems were associated with organizational profitability. Lifestyle medicine professionals may demonstrate a significant return on investment by creating a healthier and more productive workforce.
- Employers, organizations, and national economies are under increasing global pressure to improve performance, optimize efficiency, and deliver value [1]. The size of the labor force in Japan is declining due to an aging population and fewer children being born. If this trend continues, the country’s gross domestic product will inevitably decline. The Japanese government, businesses, and citizens are working hard to solve this problem. One of the solutions to avoid a decline in the Japanese economy is to increase human performance by optimizing how to leverage the human assets of an organization. Human performance is expected to be greater when people are physically and emotionally able to work and have the desire to work [2-4]. Higher levels of human performance lead to higher levels of productivity, which in turn potentially lead to higher profits [5].
- In Japan, the Ministry of Economy, Trade and Industry (METI) has defined essential elements of an integrated health protection and health promotion model to create healthier, high-performing workforces. The program is known in Japan as Kenko (health) Keiei (business). As a part of the efforts to achieve one of the goals set in Japan’s Revitalization Strategy, in 2014 the METI and the Tokyo Stock Exchange (TSE) decided to jointly designate qualifying companies as Health and Productivity Stock Selections—companies enhancing value through health and productivity management. This program evaluates companies’ health and productivity management efforts using a scoring system based on an annual survey. Companies ranked in the top 20% of all respondents are certified as outstanding health and productivity management organizations. The Health and Productivity Stock Selection designation is expected to incentivize more companies to undertake health and productivity management practices to enhance employees’ vitality and productivity, leading to increased mid-term to long-term performance and corporate value as well as improving investors’ understanding and evaluation of organizations [6,7].
- Through this program, METI and TSE encourage companies to further enhance efforts for health and productivity management. However, the associations between specific approaches in health and productivity management and organizational profitability have not yet been studied. Identifying strongly correlated approaches could help companies make better decisions regarding the development and implementation of employee health programs. These decisions would consequently improve performance and productivity, increase value for investors, and strengthen the national economy. Using a dataset that includes quantitative and qualitative responses from a survey on health and productivity management, we identified health and productivity factors associated with organizational profitability.
INTRODUCTION
- METI conducted an annual survey on Health and Productivity Management between August 2014 and October 2021. The survey included approximately 60 questions in 5 domains: (1) the prioritization of health and productivity goals in the organization’s management philosophy and policies; (2) processes for improving health and productivity; (3) specific systems and metrics for implementing health-conscious management approaches; (4) metrics for assessing and improving these approaches; and (5) compliance with laws, regulations, and risk management priorities [8,9]. The survey questions have been expanded every year, and thus there is variance in the available information between 2014 and 2021. A financial performance measure (i.e., profit) was included beginning in 2017. Therefore, we used the dataset collected from 2017 to 2020 for our analyses. The survey was conducted at of the end of each fiscal year (FY). The FY2017 survey covered the period from April 2016 to March 2017, the FY2018 survey covered the period from April 2017 to March 2018, and The FY2020 survey covered the period from April 2019 to March 2020. The coronavirus disease 2019 pandemic has hurt the economy and negatively impacted many companies’ financial performance. Therefore, we did not use data collected for FY2021 (i.e., data from April 2020 to March 2021).
- When we defined baseline data collected for FY2017 as the exposure and the rate of change in profits from FY2017 to FY2020 as the outcome, the number of companies with corresponding data for use in the analyses was 842. When we defined baseline data collected for FY2018 as the exposure and the rate of change in profits from FY2018 to FY2020 as the outcome, the number of companies with corresponding data for use in the analyses was 751. When the same company responded in both 2017 and 2018, we used the response from 2017. We combined and analyzed both sets of data (i.e., n= 1,593), since the content in the survey was largely similar between 2017 and 2018. We did not use data from companies that did not complete the survey in both FY2017 and FY2018 and did not use surveys in which the content was not directly related to health and productivity management. Supplementary Material 1 summarizes the survey questions used for the current analysis.
- Statistical analysis
- Companies’ financial performance may be affected by the number of regular/non-regular employees. For each company, we calculated its profit divided by the number of employees each year and evaluated the rate of change in profit per employee between baseline (2017 or 2018) and 2020. The distribution of increases in corporate profit is shown in Supplementary Material 2. We categorized all companies into quartiles based on the rate of change in profit after baseline, and defined the highest-quartile group as comprising companies that had an increase in corporate profit.
- The high multicollinearity among variables in the dataset limits accuracy and reliability in identifying associated factors. Therefore, we used eXtreme Gradient Boosting (XGB) [10], a classification approach that is robust with regard to multicollinearity. The XGB approach enabled us to rank factors in order of their strength of association with corporate profitability.
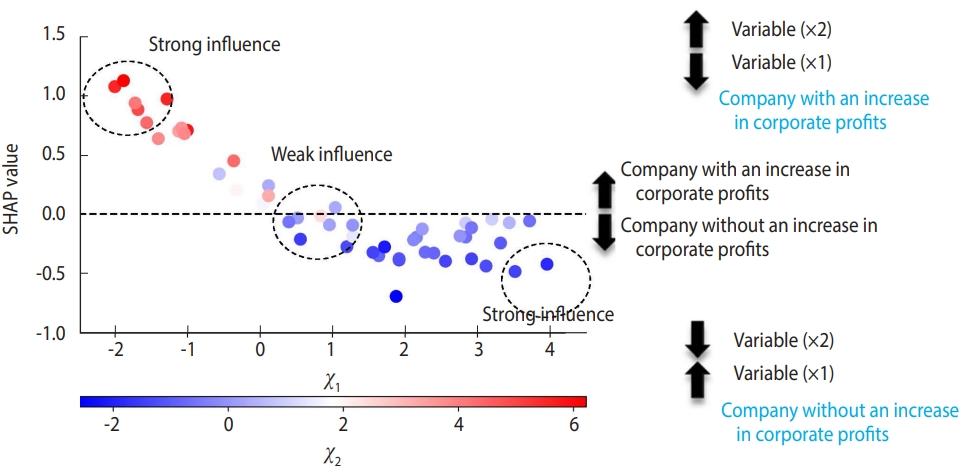
- To determine the hyperparameters of classifiers (specified by the analyst for optimizing the model performance), we used a 5-fold stratified cross-validation randomization and grid search approach. A hyperparameter is a parameter that is used to control the learning process (e.g., number of random forest trees) as opposed to parameters, the weights of which are learned during the training (e.g., variable weights). Tuning hyperparameters refers to iterations of the model architecture after seting the parameter weights to achieve the ideal performance. Five-fold cross-validation-based accuracy, defined as (true positive+true negative)/ (true positive+false negative+false positive+true negative) was evaluated for all possible combinations of hyperparameters. We selected the combination of hyperparameters that optimized the accuracy of model building. The hyperparameters considered for optimization included subsample, reg_lambda, reg_alpha, min_child_weight, max_depth, gamma, and colsample_bytree. Then, for each combination of these values, the model was fitted to 4 training folds and evaluated using a remained test fold. Finally, the average of the results was considered. We used SHapley Additive exPlanations (SHAP) values, which could explain black-box machine learning algorithms [11]. SHAP estimates values to determine each feature’s contribution to the output of the model (Figure 1). The SHAP value delineates between a condition being true (value > 0.0, companies with an increase in corporate profits) and it being false (value < 0.0, companies without an increase in corporate profits). The more a specific value of a sample influences the composition of the model, the farther the point will migrate away from zero on the y-axis. If the value of a sample does not influence the model, it will reside near or at 0 on the y-axis. In the example, a lower value of “X” and larger value of “Z” are highly predictive of the company having an increase in corporate profits, with these values strongly influencing the model “Y.” In the current study, we listed the top 10 features (factors) associated with corporate profitability. To evaluate the accuracy of the model, we provided a confusion matrix for binary classification, including measures of overall classification accuracy and the area under the precision-recall curve (AUC-PR). We defined a model with the AUC-PR curve > 0.90 as robust and acceptable. All analyses were performed with Python version 3.9.7 (Python Software Foundation, Wilmington, DE, USA).
- Ethics statement
- We conducted this study under the oversight of the Ethical Committee of the Shiga University of Medical Science (RRB21-053-2) and in accordance with the principles of the Declaration of Helsinki. Because of the deidentified nature of records (i.e., survey questions for companies), informed consent was not obtained for each individual in accordance with the Ethical Guidelines for Medical and Health Research Involving Human Subjects in Japan.
MATERIALS AND METHODS
- The database included survey results from 1,593 companies (n= 4,359,834 employees; Table 1). The types of industries represented among the 1,593 companies included construction (n= 69, 4.3%), food (n = 53, 3.3%), chemistry (n = 65, 4.1%), electrical manufacturing (n= 94, 5.9%), transportation equipment (n= 61, 3.8%), shipping (n=55, 3.5%), telecommunication (n=198, 12.4%), wholesale (n= 117, 7.3%), retail (n= 179, 11.2%), financial services (n= 139, 8.7%), professional services (n= 202, 12.7%), other (n = 361, 22.7%). Employees’ mean ± standard deviation age at baseline was 40.3±3.4 years, the proportion of women was 25.8%, and the mean length of service for employees was 14.2± 4.9 years.
- eXtreme Gradient Boosting model performance
- Table 2 shows an evaluation of model performance. The confusion matrix for evaluating model performance showed an accuracy of 0.997, precision of 0.993, recall of 0.997, AUC of 0.999, and AUC-PR of 0.999.
- Feature importance assessment
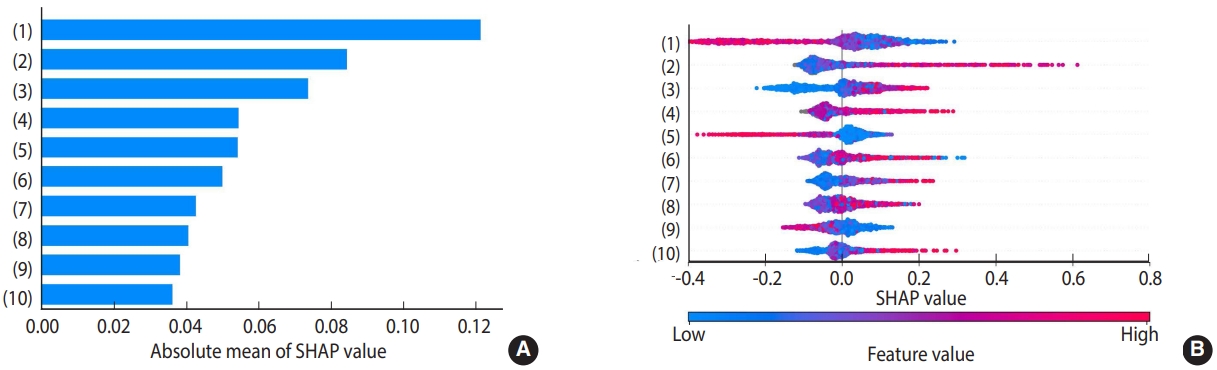
- Figure 2 illustrates the relative importance of features related to an increase in corporate profits. Based on SHAP values from the XGB model, the top 10 features with the strongest correlations to corporate profits included the percentage of current smokers (SHAP value, 0.121), per-employee cost of health services (0.084) and medical services (0.050), the percentage of full-time employees working in sales departments (0.074) and distribution or customer service departments (0.054), the percentage of employees who slept well (0.055), the percentage of employees within a company who regularly exercised (0.043), the amount of per-employee annual welfare expenses (0.041), the number of employees who left the company during the fiscal year (0.038), and the percentage of employees assigned to “other role” departments (0.036).
RESULTS
- Using data from a survey on national health and productivity management, we identified the top 10 factors in health and productivity management associated with an increase in organizational profitability, including employees’ lifestyle-related health risk factors (i.e., smoking, sleep, and exercise) and the organization’s management philosophy, policies, and systems. Prior associations of employees’ lifestyle-related health risk factors with worker productivity and healthcare costs have been reported [12-18]. However, these associations were assessed among a relatively small number of companies, and in those studies it is unclear whether employees’ lifestyle-related health risk factors (e.g., the percentage of current smokers) within a company were associated with organizational profitability. Furthermore, when assessing the associations of employees’ lifestyle-related health risk factors with organizational profitability, no studies have integrated information regarding the organization’s philosophy, policies, and specific systems and metrics related to health and productivity management. The current study extends existing knowledge by demonstrating that employees’ lifestyle-related health risk factors (i.e., smoking, sleep, and exercise) were more closely correlated with organizational profitability than the organization’s management philosophy, policies, and systems.
- The mechanisms affecting employees’ lifestyle-related health risk factors and organizational profitability in the current study remain uncertain. However, there is a wealth of research connecting lifestyle-related health risk factors to worker productivity [19]. For example, worker productivity losses associated with smoking occur due to absenteeism, disability, and presenteeism associated with illness, smoking breaks, increased on-the-job accidents, and worker compensation costs, as well as the effect of secondhand smoke on coworkers [15,20]. Increasing physical activity has been shown to be linked to improvements in health conditions, a person’s overall physical and mental well-being, and reduced absenteeism [21-23]. Workplace sleep health promotion programs, including sleep hygiene, yoga, physical activity, and cognitive-behavioral therapy for insomnia, may increase employees’ sleep duration and subsequent daytime performance [24]. In a prior study of 4 Japanese companies (3,126 women and 12,350,9224 men), the monetary value due to absenteeism was US$520 per person per year, that of presenteeism was US$3,055, and medical/pharmaceutical expenses were US$1,165 [17]. Future studies of health and productivity management should include assessments of worker health, absenteeism, disability and presenteeism costs, which could address the mechanisms underlying the association of employees’ lifestyle-related health risk factors and organizational profitability.
- The current study used an observational study design, and despite robust statistical techniques, this limits its ability to establish a causal relationship between organizational health and productivity management and profitability. For example, the associations of higher per-employee costs for health services and medical services with increasing corporate profits may be explained by the fact that a company with increasing profits can provide better benefits for employees, including health insurance, tuition reimbursement, wellness stipends, and paid parental leave. Consequently, employees in a company with increasing profits may be less likely to have certain lifestyle-related health risk factors compared to employees in a company without increasing profits. The possibility of residual, unmeasured confounding also could not be excluded. The current study could not address whether the association of organizational health and productivity management with profitability is independent of factors that affect financial performance, including liquidity, ownership, age and size, leverage, solvency, and asset turnover [25,26].
- Organizations’ management philosophy, policies, and systems were assessed using dichotomous yes/no questions in the survey. These survey questions were aggregated and coded for analyses as “conducted something= 1” for any “yes” answer or “conducted nothing= 0” for all “no” answers. Therefore, the companies in the “conducted something” group must be assumed to have used heterogeneous approaches. Further research is needed to identify specific health and productivity management strategies and systems that improve employees’ lifestyle-related health risk factors (i.e., systems that reduce smoking and improve sleep quality and exercise). These strategies and systems may not be identical across companies because of cultural differences across industries or due to company histories.
- In this study of national health and productivity management programs, we demonstrated associations between employees’ lifestyle-related health risk factors and organizational profitability. By identifying and addressing health risks that impair worker performance, lifestyle medicine professionals may be able to provide a significant return on investment by creating a healthier and more productive workforce.
DISCUSSION
- We used survey responses from companies (i.e., aggregated data from multiple respondents from the same company to yield the company’s response), not individual participant data. Therefore, the survey data can be shared for purposes of reproducing the results or replicating the procedures by submitting a manuscript proposal to the Ministry of Economy, Trade and Industry (https://www.meti.go.jp/policy/mono_info_service/healthcare/kenko_keiei.html). The data will become available immediately following publication.
DATA AVAILABILITY
SUPPLEMENTARY MATERIALS
Supplementary Material 1.
Supplementary Material 2
-
CONFLICT OF INTEREST
The authors have no conflicts of interest to declare for this study.
-
FUNDING
This work was supported by a research grant from Japan Health Industry Federation (https://www.well-being100.jp/).
-
AUTHOR CONTRIBUTIONS
Conceptualization: Yano Y, Node K, Mizuno A, Tsuji I, Okada K. Data curation: Kanegae H. Formal analysis: Kanegae H. Funding acquisition: Yano Y. Methodology: Yano Y, Node K, Mizuno A, Tsuji I, Okada K. Project administration: Yano Y, Node K, Mizuno A, Tsuji I, Okada K. Visualization: Yano Y. Writing – original draft: Yano Y. Writing – review & editing: Kanegae H, Node K, Mizuno A, Nishiyama A, Rakugi H, Itoh H, Kitaoka K, Kashihara N, Ikeno F, Tsuji I, Okada K.
NOTES
ACKNOWLEDGEMENTS


- 1. Parkinson MD. Employer health and productivity roadmap™ strategy. J Occup Environ Med 2013;55(12 Suppl):S46-S51.ArticlePubMed
- 2. Edington DW. Zero trends: health as a serious economic strategy. Ann Arbor: Health Management Research Center; 2009. p. 199.
- 3. Shi Y, Sears LE, Coberley CR, Pope JE. The association between modifiable well-being risks and productivity: a longitudinal study in pooled employer sample. J Occup Environ Med 2013;55:353-364.PubMed
- 4. Kirkham HS, Clark BL, Bolas CA, Lewis GH, Jackson AS, Fisher D, et al. Which modifiable health risks are associated with changes in productivity costs? Popul Health Manag 2015;18:30-38.ArticlePubMed
- 5. Goetzel RZ, Ozminkowski RJ. Health and productivity management: emerging opportunities for health promotion professionals for the 21st century. Am J Health Promot 2000;14:211-214.ArticlePubMedPDF
- 6. Ministry of Economy, Trade and Industry (METI). Evaluation summaries for the 2021 certified health & productivity management outstanding organizations recognition program (large enterprise category [white 500]) have been published [cited 2022 Mar 31]. Available from: https://www.meti.go.jp/english/press/2021/0617_001.html.
- 7. Ministry of Economy, Trade and Industry (METI). Medical and nursing care, and health [cited 2022 Mar 31]. Available from: https://www.meti.go.jp/english/policy/mono_info_service/medical/index.html#press.
- 8. Ministry of Economy, Trade and Industry (METI). Promoting health and productivity management [cited 2022 Apr 9]. Available from: https://www.meti.go.jp/policy/mono_info_service/healthcare/kenko_keiei.html (Japanese).
- 9. Ministry of Economy, Trade and Industry (METI). Evaluation sheets published for 2,000 enterprises under the FY2021 Survey on Health and Productivity Management; 2022 [cited 2022 Apr 9]. Available from: https://www.meti.go.jp/english/press/2022/0315_002.html.
- 10. Chen T, Guestrin C. Xgboost: a scalable tree boosting system. In Proceedings of the 22nd Acm sigkdd International Conference on Knowledge Discovery and Data Mining. San Francisco: 2016 Aug 13-17; p. 785-794.
- 11. Lundberg SM, Lee SI. A unified approach to interpreting model predictions. In Proceedings of the 31st International Conference on Neural Information Processing Systems (NIPS’17). New York: Curran Associates Inc.; 2017, p. 4768-4777.
- 12. Parkinson MD. The healthy health care workplace: a competitive advantage. Curr Cardiol Rep 2018;20:98.ArticlePubMedPDF
- 13. Serxner SA, Gold DB, Bultman KK. The impact of behavioral health risks on worker absenteeism. J Occup Environ Med 2001;43:347-354.ArticlePubMed
- 14. Bertera RL. The effects of behavioral risks on absenteeism and health-care costs in the workplace. J Occup Med 1991;33:1119-1124.ArticlePubMed
- 15. Halpern MT, Shikiar R, Rentz AM, Khan ZM. Impact of smoking status on workplace absenteeism and productivity. Tob Control 2001;10:233-238.ArticlePubMedPMC
- 16. Burton WN, Conti DJ, Chen CY, Schultz AB, Edington DW. The role of health risk factors and disease on worker productivity. J Occup Environ Med 1999;41:863-877.ArticlePubMed
- 17. Nagata T, Mori K, Ohtani M, Nagata M, Kajiki S, Fujino Y, et al. Total health-related costs due to absenteeism, presenteeism, and medical and pharmaceutical expenses in Japanese employers. J Occup Environ Med 2018;60:e273-e280.ArticlePubMedPMC
- 18. Allen D, Hines EW, Pazdernik V, Konecny LT, Breitenbach E. Four-year review of presenteeism data among employees of a large United States health care system: a retrospective prevalence study. Hum Resour Health 2018;16:59.ArticlePubMedPMCPDF
- 19. Burton WN, Edington DW, Schultz AB. Lifestyle medicine and worker productivity. Am J Lifestyle Med 2020;15:136-139.ArticlePubMedPMCPDF
- 20. Bunn WB 3rd, Stave GM, Downs KE, Alvir JM, Dirani R. Effect of smoking status on productivity loss. J Occup Environ Med 2006;48:1099-1108.ArticlePubMed
- 21. Jacobson BH, Aldana SG. Relationship between frequency of aerobic activity and illness-related absenteeism in a large employee sample. J Occup Environ Med 2001;43:1019-1025.ArticlePubMed
- 22. van Amelsvoort LG, Spigt MG, Swaen GM, Kant I. Leisure time physical activity and sickness absenteeism; a prospective study. Occup Med (Lond) 2006;56:210-212.ArticlePubMed
- 23. Chakravarthy MV, Joyner MJ, Booth FW. An obligation for primary care physicians to prescribe physical activity to sedentary patients to reduce the risk of chronic health conditions. Mayo Clin Proc 2002;77:165-173.ArticlePubMed
- 24. Robbins R, Jackson CL, Underwood P, Vieira D, Jean-Louis G, Buxton OM. Employee sleep and workplace health promotion: a systematic review. Am J Health Promot 2019;33:1009-1019.ArticlePubMedPMCPDF
- 25. Deitiana T, Habibuw LG. Factors affecting the financial performance of property andreal estate companies listed at Indonesia stock exchange. Asian Bus Rev 2015;5:79-88.ArticlePDF
- 26. Bărbuță-Mișu N, Madaleno M, Ilie V. Analysis of risk factors affecting firms’ financial performance—support for managerial decision-making. Sustainability 2019;11:4838.Article
REFERENCES
Figure & Data
References
Citations
- Role and Value of the Corporate Medical Director
Gregg M. Stave, Wayne N. Burton, Richard J.L. Heron, T. Warner Hudson, J. Brent Pawlecki, David Roomes, Martin J. Sepulveda, Michael Rendel, Pamela A. Hymel
Journal of Occupational & Environmental Medicine.2023; 65(12): e797. CrossRef
 PubReader
 ePub Link
 Cite
Cite