Articles
- Page Path
- HOME > Epidemiol Health > Volume 46; 2024 > Article
-
Original Article
Decomposition of socioeconomic inequalities in glaucoma knowledge in Taiwan -
Chiun-Ho Hou1,2
 , Christy Pu1
 -
Epidemiol Health 2023;46:e2024004.
DOI: https://doi.org/10.4178/epih.e2024004
Published online: December 5, 2023
1Institute of Public Health, National Yang Ming Chiao Tung University School of Medicine, Taipei, Taiwan
2Department of Ophthalmology, National Taiwan University Hospital, Taipei, Taiwan
- Correspondence: Christy Pu Institute of Public Health, National Yang Ming Chiao Tung University School of Medicine, 155 Section 2, Li-Nong Street, Taipei 112, Taiwan E-mail: cypu@nycu.edu.tw
© 2024, Korean Society of Epidemiology
This is an open-access article distributed under the terms of the Creative Commons Attribution License (http://creativecommons.org/licenses/by/4.0/), which permits unrestricted use, distribution, and reproduction in any medium, provided the original work is properly cited.
- 2,997 Views
- 87 Download
Abstract
-
OBJECTIVES
- Glaucoma knowledge is strongly associated with medication adherence and preventive behavior. Studies have frequently reported socioeconomic inequalities in glaucoma knowledge. This study aimed to decompose such inequalities. Decomposition analysis enables the design of policies directly targeting the underlying causes of inequality.
-
METHODS
- We performed a cross-sectional survey from January 1, 2019 to June 30, 2019, at the departments of ophthalmology of 2 medical centers belonging to a hospital chain in northern Taiwan. Socioeconomic inequalities in glaucoma knowledge were ranked based on 3 aspects of socioeconomic status (SES): (1) education, (2) income, and (3) self-perceived financial status. The concentration index was calculated and decomposed using decomposition analysis. Elasticity and marginal effects were estimated for each decomposed factor.
-
RESULTS
- In total, 1,203 patients completed the survey. Both measures of glaucoma knowledge and overall glaucoma knowledge score significantly contributed to the progressivity of knowledge inequalities (pro-high-SES inequalities). The concentration index for overall knowledge score with respect to education was 0.166 (p<0.001). Both objective and subjective measures of SES were associated with pro-high-SES inequalities. Our decomposition analysis revealed that demographic factors and attitudinal factors such as the level of concern regarding developing glaucoma contributed significantly to SES-based inequalities in glaucoma knowledge.
-
CONCLUSIONS
- Our decomposition analysis provided empirical evidence regarding the underlying causes of SES-based inequalities in glaucoma knowledge. Efforts to improve glaucoma knowledge should consider specific factors that drive SES-based inequalities, such as age, sex, and concern about vision health, to ultimately achieve low SES-based inequalities.
- Inequalities in vision health have often been attributed to socioeconomic disparities. The global burden of glaucoma has been increasing over the years, and people of lower socioeconomic standing experience a greater glaucoma burden [1]. Low income and lack of health insurance coverage are associated with unmet needs for cataract surgery [2]. In the United States, people in poverty or with lower income have been reported to be significantly less likely to make ophthalmology visits [3,4]. The prevalence of blindness has also been shown to be higher among people with lower income [5].
- Glaucoma is the second leading cause of blindness worldwide, and visual field status deterioration is strongly associated with vision-related quality of life [6]. Although glaucoma has severe consequences, people at risk of glaucoma are often unaware of the risks or symptoms of the disease [7-9]. Knowledge of glaucoma is thus essential to treatment adherence [10-12]. Health literacy has also been shown to be strongly associated with adherence to glaucoma therapy [13]. Accordingly, education about the symptoms of glaucoma and visual impairment can be a vital first step in promoting proactive ophthalmic health care [14]. However, studies have often reported unsatisfactory levels of glaucoma knowledge, particularly among patients with glaucoma [15,16] and the public [17].
- Policymakers and researchers’ interest in glaucoma knowledge has evolved beyond a simple understanding of the positive relationship between glaucoma knowledge and patient outcomes; such interest has shifted toward identifying the underlying causes of knowledge inequality. Nevertheless, addressing socioeconomic problems that affect glaucoma knowledge can be difficult. To overcome this difficulty, interventions specifically targeting underlying factors are likely to be helpful.
- Studies have addressed the relationship between lower socioeconomic status (SES) and poor glaucoma knowledge. Hoevenaars et al. [16] demonstrated that poor glaucoma knowledge was associated with low education levels. A study conducted in Ghana revealed that higher education levels were associated with greater awareness of glaucoma, although awareness is not equivalent to accurate glaucoma knowledge [18]. A study performed in Mexico determined that individuals with higher education levels were approximately 4 times more likely to have accurate glaucoma knowledge [19]. In general, health literacy is lower among individuals with lower SES, and low health literacy may explain SES-based health disparities [20]. Low SES has been reported to be associated with a greater prevalence of glaucoma as well as a greater severity of glaucoma at presentation [21,22], and this is attributable to lower glaucoma knowledge in individuals of lower SES.
- Studies have yet to decompose socioeconomic inequalities in glaucoma knowledge in order to identify their underlying factors. Decomposing such inequalities is essential for policy-making because it can provide empirical evidence on factors that can mitigate or exacerbate the inequalities.
- The aim of the present study was to measure socioeconomic inequalities in glaucoma knowledge by using the concentration index. The concentration index is often utilized to measure disparities in variables associated with SES [23]. We then decomposed such inequalities to identify their underlying factors. Our study is the first to decompose socioeconomic inequalities in glaucoma knowledge. Accordingly, this study contributes to the literature on glaucoma knowledge inequalities by providing evidence on the distribution of glaucoma knowledge across socioeconomic gradients. This study also expands the literature on glaucoma knowledge inequalities by establishing the contribution of socioeconomic inequalities to glaucoma knowledge inequalities.
INTRODUCTION
- Data
- We performed a cross-sectional survey from January 1, 2019 to June 30, 2019, at the ophthalmology departments of 2 medical centers belonging to a hospital chain in northern Taiwan. Patients who sought care from 4 designated physicians at the ophthalmology departments during the study period were approached and invited to participate in the study. For this survey, we designed a questionnaire to collect information on the participants’ characteristics and their glaucoma knowledge. Specifically, the questionnaire included sections on the respondents’ demographic characteristics and SES and their knowledge of the causes and symptoms of glaucoma (as explained in the Measures section). The questionnaire was reviewed by 6 ophthalmologists and 2 public health experts. The questionnaire was pretested. To assess questionnaire reliability, 15 patients from the pretest were asked to complete the questionnaire again upon their next visit.
- In the final survey, all participants were provided copies of the questionnaire in paper format, and they completed the questionnaires by themselves. Trained assistants were present to answer any questions the respondents might have while completing the questionnaires.
- Taiwan implemented a National Health Insurance (NHI) program in 1995. This program provides coverage for essential medical care and pharmaceuticals, thus eliminating most financial barriers to medical care. We linked our survey data to NHI claims data to obtain information about the number of ophthalmology visits within 1 year before the survey as well as information about insurable income. The inclusion of the number of ophthalmology visits served as a proxy for recent visits to ophthalmologists, which was identified as a predictor for awareness of glaucoma as a leading cause of blindness in the study conducted by Ichhpujani [14]. It is important to note, however, that Ichhpujani’s study focused on 119 staff members from a tertiary hospital, who may have had significantly different characteristics from the participants in our own study.
- Socioeconomic status measures
- Education level was self-reported by the respondents and was considered a categorical variable with the following categories: (1) primary school or illiterate, (2) junior high school, (3) senior high school, and (4) college and above. The original categorical response was converted to corresponding years of education and was analyzed as a continuous variable.
- Because income is often misreported in surveys and because non-response is not uncommon [24], we recorded income as the insurable income from the NHI database. This income measure was thus free from reporting bias and non-response bias. Income was treated as a continuous variable.
- We also employed subjective financial status measures. Several studies have documented the importance of using subjective SES in health disparity studies [25,26]. Accordingly, in our survey, we measured subjective SES by using the following question: “How would you rate your household financial status?” Answers to the question were as follows: “lots of surplus,” “some surplus,” “balanced,” “some shortages,” and “considerable shortage.”
- Glaucoma knowledge
- We used 2 measures of glaucoma knowledge—namely, general knowledge on glaucoma and knowledge on glaucoma risk factors. We designed items to measure such knowledge based on the relevant literature. Each item had 3 response options: (1) “true,” (2) “false,” and (3) “don’t know.” The third option (“don’t know”) was included to prevent participants from accidentally guessing the correct response. General knowledge on glaucoma was measured using the following items: (1) “Glaucoma can be completely cured,” (2) “Cataract can lead to glaucoma,” (3) “Overuse of the eyes can lead to glaucoma,” (4) “People with no family history have lower chances of getting glaucoma,” (5) “Early-stage glaucoma does not have symptoms,” and (6) “Generally speaking, ocular pressure lower than 30 mmHg is considered normal.” Knowledge on glaucoma risk factors was measured according to the respondents’ responses to whether any of the following items are risk factors for glaucoma: (1) genetics, (2) high intraocular pressure, (3) high myopia or hyperopia, (4) ocular trauma, (5) long-term use of steroids, (6) diabetes, (7) hypertension, (8) obesity, (9) lack of exercise, (10) unbalanced diet, (11) overuse of electronic devices, and (12) lack of sleep.
- Concentration index
- The concentration index is commonly employed to gauge inequalities in a specific variable that is linked to SES [23]. The concentration index Cx can be derived as follows [27]:
- Where Ei is the variable for which an inequality is measured, S is the socioeconomic variable to be investigated, and Pi is the fractional socioeconomic rank. C ranges from (1−n)/n—representing maximal pro-low-SES inequalities—to (n−1)/n, representing maximal pro-high-SES inequalities [27].
- We used the method proposed by Kakwani [28] to decompose inequalities in glaucoma knowledge scores according to individual SES. In this method, factors that might be associated with an inequality (denoted x) are analyzed. Total glaucoma knowledge scores are expressed as a linear function of x. The Cx value is decomposed into the sum of px, where px represents the product of the elasticity of glaucoma knowledge with respect to x and the degree to which such knowledge is unevenly distributed across the SES variable of interest (as measured by the concentration index for x) [29]. Elasticity represents the sensitivity of SES-based inequalities in glaucoma knowledge to changes in the concentration index of a given factor. Subsequently, we defined a residual component for inequalities that could not be explained by the regressors. To implement the decomposition analysis, we used linear regression to estimate the association between the glaucoma knowledge score and the explanatory variables. The covariates included age, sex, marital status (never married, married/cohabiting, widowed, separated), self-rated financial status, place of residence (Taipei, others), employment status (employed, unemployed, retired), self-rated health, weight (underweight, normal weight, overweight, obese), smoking status (never smoker, smoker, ex-smoker), glaucoma (yes/no), cataract (yes/no), self-perceived glaucoma risk (very high risk, average risk, low risk, no idea, already have glaucoma/blind), concern about current vision health (very worried, worried, not worried), and number of outpatient ophthalmology visits in the past year. We selected our final model in accordance with Akaike’s information criterion [30].
- Ethics statement
- The study was approved by the Institutional Review Boards (IRBs) of National Yang-Ming University and the two medical centers involved in the study (IRB approval No. YM109014E). Informed consent was confirmed by the IRB.
MATERIALS AND METHODS
Survey data
National Health Insurance claims data
Education (objective SES measure)
Income (objective SES measure)
Satisfaction with current financial status (subjective SES measure)
- Table 1 presents participants’ characteristics stratified by their mean education level. Participants with <10 years of education were older and less likely to be males than were those with > 10 years of education. Participants with < 10 years of education were also less likely to report having surplus household income and had significantly lower income than those with > 10 years of education. Thus, the 3 SES variables were highly correlated.
- Participants with lower education levels were significantly less likely to be employed than those with higher education levels, possibly because of their older age. Participants with lower education levels were more likely to report themselves as having poor health. However, they were more likely to have never smoked. They were also more likely to report that they had no idea about their risk of developing glaucoma and report that they were not worried about vision health.
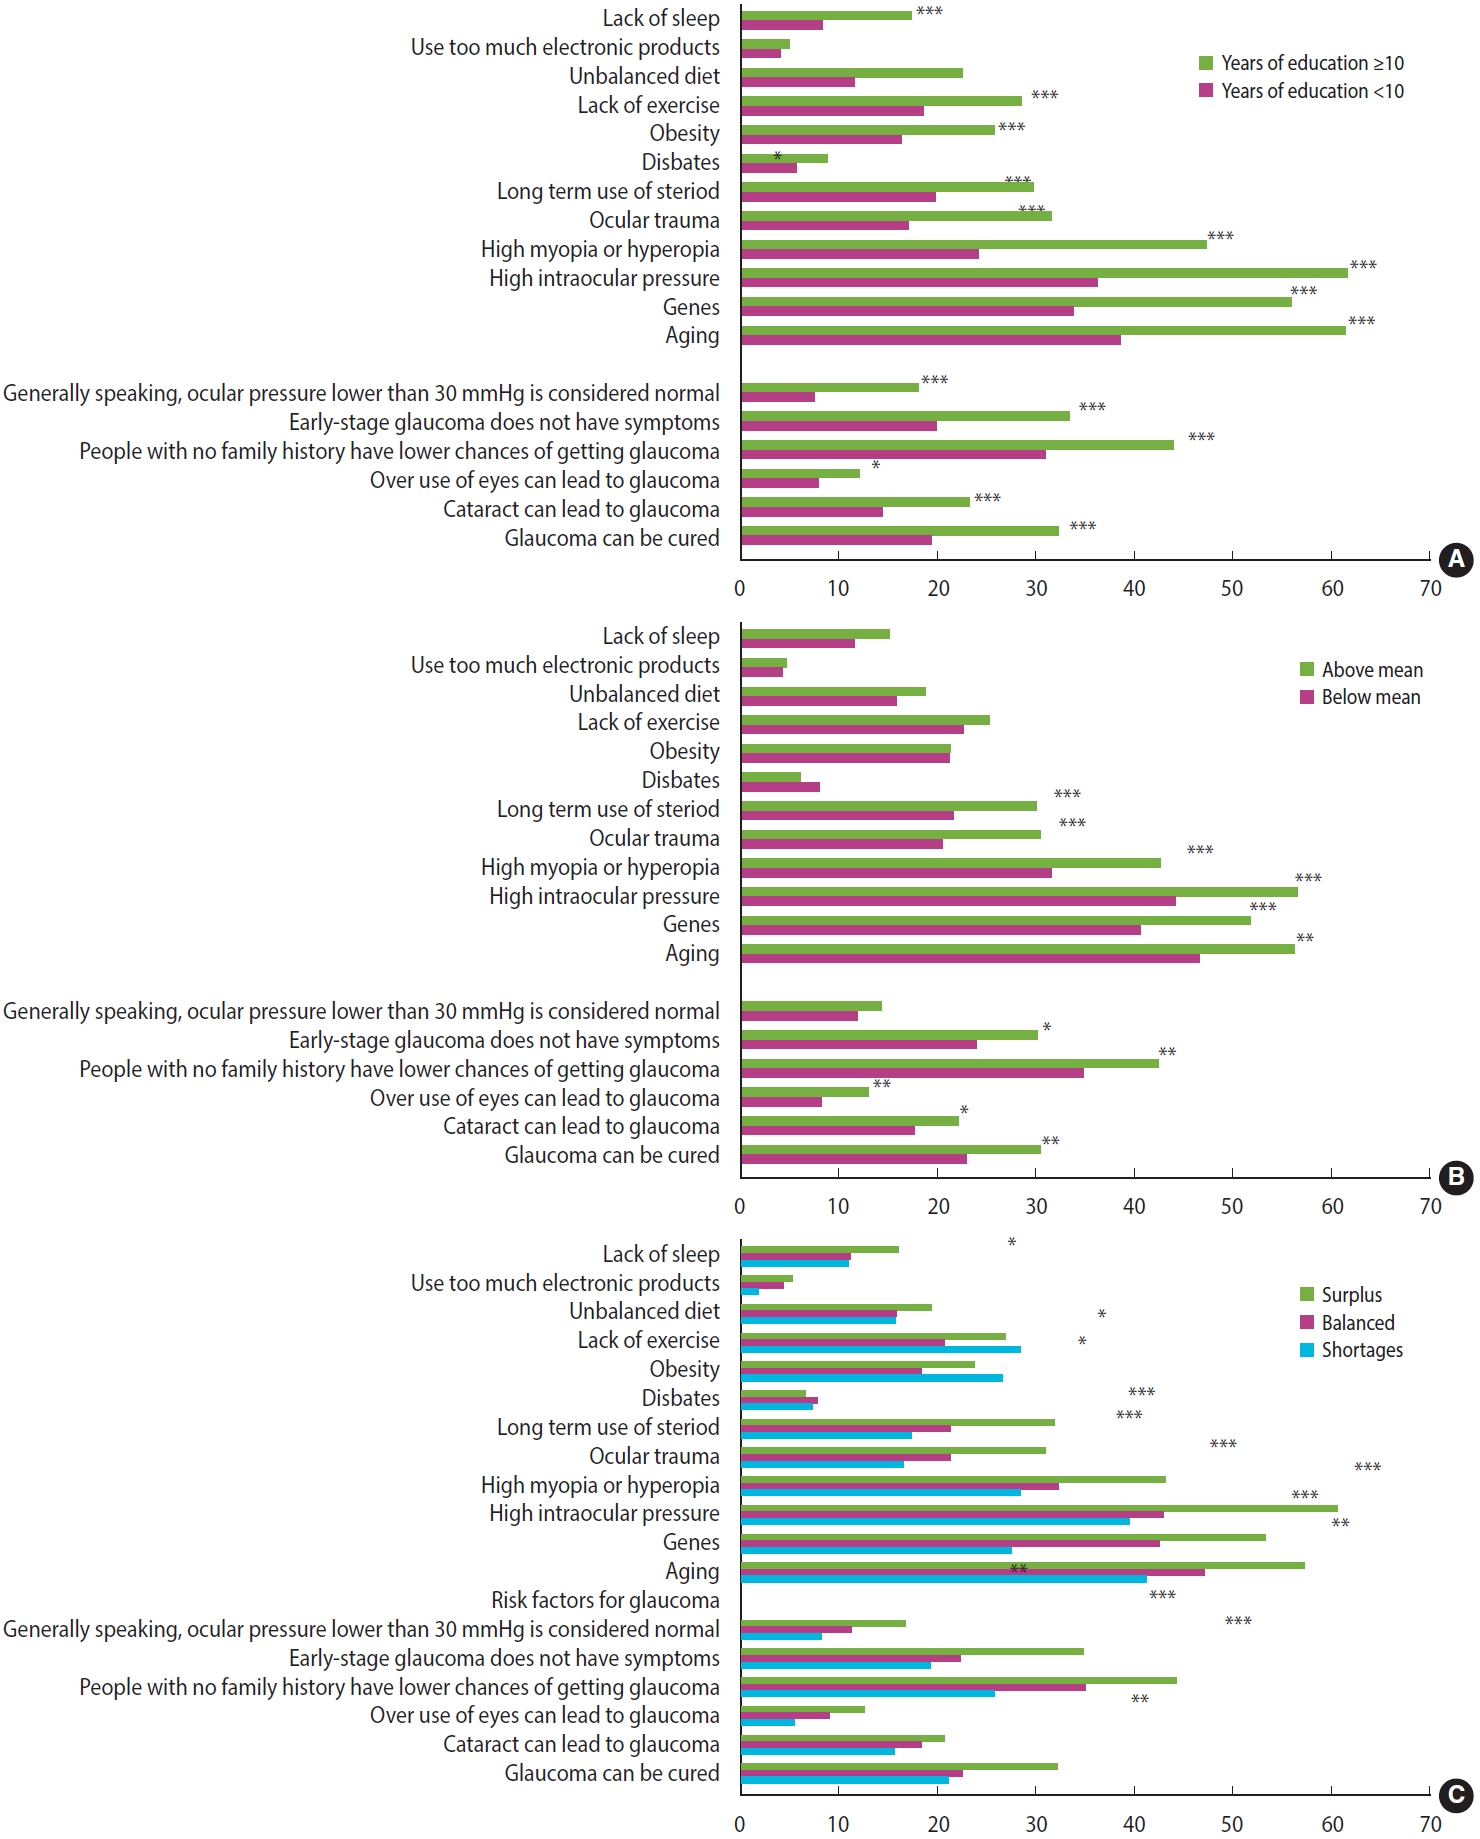
- Regarding glaucoma risk factors, we observed that the proportion of correct responses to the questions differed significantly by education level (Figure 1A). The proportion of correct responses to all questions was higher among participants with higher education level. However, the proportion of participants with correct answers was generally low, regardless of years of education. For participants with > 10 years of education, the question as to whether high intraocular pressure is a risk factor for glaucoma had the highest proportion of correct responses. However, only 61.6% of the participants with > 10 years of education answered this question correctly, and only 36.2% of those with fewer years of education answered this question correctly.
- Regarding general knowledge of glaucoma, less than 20% of the participants knew what the normal intraocular pressure range is, regardless of education level. This may be relatively unsurprising because this was considered one of the more difficult questions; nevertheless, the participants also answered poorly on easier questions such as whether early stages of glaucoma have symptoms.
- The distributions of glaucoma knowledge by income and self-reported financial status (Figure 1B and C) exhibited similar patterns. For self-reported financial status, we combined the “lots of surplus” and “some surplus” categories and combined the “considerable shortage” and “some shortage” categories to ensure a reasonable number of participants in each category. We noted a clear dose-response relationship between glaucoma knowledge score and self-reported financial status; participants with higher self-reported financial status were more likely to provide correct responses.
- Table 2 presents the concentration index values derived for the glaucoma knowledge measures according to the various SES measures. A positive concentration index value was considered to indicate progressive (pro-high-SES) inequality, whereas a negative value was considered to indicate regressive (pro-low-SES) inequality. Education level was associated with the largest progressivity of inequalities in glaucoma knowledge, indicating a significant inequality favoring participants with higher education levels. We also observed progressivity in all knowledge scores when the participants were ranked by income and self-reported financial status, although the corresponding magnitudes were smaller than those observed when the participants were ranked by years of education.
- Table 3 presents the results of the decomposition of SES-based inequalities for overall glaucoma knowledge score. We observed that age was a major contributor to inequalities based on education, accounting for approximately 17% of the inequalities observed. Age was thus determined to be a factor exacerbating pro-high-SES-based inequalities in glaucoma knowledge. We obtained similar results for inequalities based on income. However, age contributed only 2.2% of inequalities based on self-perceived financial status.
- Sex contributed negatively to inequalities based on all 3 SES measures. This means that sex mitigated pro-high-SES inequalities. However, sex contributed approximately 9% of inequalities based on education level and only 1.7% of inequalities based on self-reported financial status. Marital status also contributed negatively to progressivity; it accounted for approximately 18% of inequalities based on education level.
- Self-reported financial status and income accounted for 5.6% of the progressivity observed for inequalities based on education level. This signifies that self-rated financial status and income are not major contributors to education-based glaucoma knowledge inequalities. However, education level accounted for 75.4% and 58.6% of the progressivity observed for inequalities based on self-reported financial status and income, respectively.
- Self-perceived glaucoma risk and concern about vision health together accounted for 5.6% of inequalities based on education level and accounted for 4.3% of inequalities based on income, but they accounted for only 0.3% of inequalities based on subjective SES. The number of outpatient ophthalmology visits in the past year was not a major contributor to glaucoma knowledge inequalities based on all 3 SES measures.
RESULTS
- In this study, we analyzed socioeconomic inequalities in glaucoma knowledge and decomposed them using different SES measures. Our major findings are outlined as follows: (1) Both measures of glaucoma knowledge and overall knowledge score exhibited significant progressivity (i.e., pro-high-SES inequalities). (2) Pro-high-SES inequalities were observed for both objective and subjective SES measures. (3) Although the 3 SES measures were positively correlated, factors accounting for SES-based glaucoma knowledge inequalities differed significantly for the various SES measures.
- This study has several strengths. First, previous studies have not decomposed the factors explaining SES-based glaucoma knowledge inequality; thus, designing policies to reduce this SES-based disparity is extremely difficult. Only by knowing the factors behind this disparity can policies be designed to address the factors directly. We tested a wide range of SES measures, making our results useful for policy design for subpopulations where one SES measure may be more important for measuring inequality than others. Second, we tested 2 types of glaucoma knowledge, making it possible to provide a detailed breakdown of the types of glaucoma knowledge subject to SES-based inequality.
- We identified that among the 3 SES measures, education level consistently accounted for the largest proportion of SES-based inequalities in glaucoma knowledge. Education level still accounted for a considerable proportion of such inequalities based on income and subjective SES. This signifies that regardless of the SES measures used, improving glaucoma knowledge in individuals with relatively low education levels could be an effective disparity-reducing strategy. Individuals with higher education levels may have greater cognitive abilities, 31 allowing them to gain glaucoma knowledge more easily. Such cognitive abilities may not be associated with higher self-rated financial status or higher income. Accordingly, future studies on SES-based disparities in health literacy should not ignore the importance of disparities in education.
- We found that age contributed positively to the progressivity of SES-based inequalities in glaucoma knowledge. A possible explanation for this finding is that older people have more experience with ophthalmic conditions. This thus validates the necessity of increasing education programs on ophthalmic conditions for younger patients. A United States study reported that poorer glaucoma medication adherence was more common in patients aged < 50 years or ≥ 80 years [11]. Another study also revealed that very young and very old patients had relatively low glaucoma knowledge [12]. Accordingly, providing glaucoma education to these individuals can help reduce socioeconomic inequalities in glaucoma knowledge.
- The number of outpatient ophthalmology visits in the past year did not have a considerable contribution to glaucoma knowledge inequalities based on all 3 SES measures. Previous studies have shown that visits to an eye practitioner or receiving eye examination were associated with higher glaucoma knowledge or awareness [14,32]. Similarly, our results suggest that under a universal health coverage system such as Taiwan’s NHI, visits to an ophthalmologist are unlikely to be correlated with income or other SES measures and would thus not contribute to SES-based inequalities in glaucoma knowledge. SES is likely to affect inequalities in glaucoma knowledge through other factors.
- We also analyzed whether concern about vision health and self-perceived risk of glaucoma explained SES-based inequalities in glaucoma knowledge. Although these factors accounted for only a moderate proportion of the observed SES-based inequalities, they exacerbated such inequalities. A United States study reported that participants who frequently failed to attend appointments at a glaucoma clinic were more likely to perceive their condition as less severe than those who attended scheduled appointments [33]. Accordingly, on the basis of our findings and those of previous studies, we suggest that to reduce SES-based glaucoma knowledge inequalities, authorities should provide information clarifying the risk of poor vision health among individuals of low SES. For example, individuals of low SES should be provided with information on the likelihood of developing glaucoma. Moreover, individuals with a high risk of glaucoma can be educated on the danger of ignoring this risk.
- This study has several limitations. First, the participants were selected from a single hospital chain; hence, the results may not be generalizable to the entire country. However, this hospital chain is the largest in Taiwan; therefore, our sample has some degree of representativeness. Second, the sample size was limited by funding availability, which may have affected the study’s statistical power. Third, although we used administrative data to measure income, income may have been mismeasured. For example, participants may have had income that was not recorded in the administrative system. Nevertheless, we believe the income measure we used should capture income more accurately than self-report measures.
- Glaucoma knowledge is vital to glaucoma prevention and treatment adherence. Implementing policies aimed at reducing SES-based inequalities in glaucoma knowledge is crucial for the achievement of equity in vision health. We decomposed inequalities in glaucoma knowledge based on SES in order to identify factors contributing to such inequalities. We observed that education level had a major contribution to SES-based inequalities in glaucoma knowledge. Our findings provide valuable information that could be useful for improving outcomes for patients with glaucoma. Additionally, efforts toward improving glaucoma knowledge should consider specific factors that contribute to poor glaucoma knowledge in individuals of lower SES.
DISCUSSION
-
Conflict of interest
The authors have no conflicts of interest associated with the material presented in this paper.
-
Funding
The study was supported by the Taiwan National Science Council. Grant number: 112-2628-B-A49-002 and 112-2314-B-002-214.
-
Author contributions
Both authors contributed equally to conceiving the study, analyzing the data, and writing this paper.
NOTES
ACKNOWLEDGEMENTS

- 1. Wu J, Yu X, Ping X, Xu X, Cui Y, Yang H, et al. Socioeconomic disparities in the global burden of glaucoma: an analysis of trends from 1990 to 2016. Graefes Arch Clin Exp Ophthalmol 2020;258:587-594 https://doi.org/10.1007/s00417-019-04484-y.ArticlePubMed
- 2. Richter GM, Chung J, Azen SP, Varma R; Los Angeles Latino Eye Study Group. Prevalence of visually significant cataract and factors associated with unmet need for cataract surgery: Los Angeles Latino Eye Study. Ophthalmology 2009;116:2327-2335 https://doi.org/10.1016/j.ophtha.2009.05.040.ArticlePubMedPMC
- 3. Zhang X, Beckles GL, Chou CF, Saaddine JB, Wilson MR, Lee PP, et al. Socioeconomic disparity in use of eye care services among US adults with age-related eye diseases: National Health Interview Survey, 2002 and 2008. JAMA Ophthalmol 2013;131:1198-1206 https://doi.org/10.1001/jamaophthalmol.2013.4694.ArticlePubMed
- 4. Rasendran C, Tye G, Knusel K, Singh RP. Demographic and socioeconomic differences in outpatient ophthalmology utilization in the United States. Am J Ophthalmol 2020;218:156-163 https://doi.org/10.1016/j.ajo.2020.05.022.ArticlePubMed
- 5. Dandona R, Dandona L. Socioeconomic status and blindness. Br J Ophthalmol 2001;85:1484-1488 https://doi.org/10.1136/bjo.85.12.1484.ArticlePubMedPMC
- 6. Alqudah A, Mansberger SL, Gardiner SK, Demirel S. Vision-related quality of life in glaucoma suspect or early glaucoma patients. J Glaucoma 2016;25:629-633 https://doi.org/10.1097/IJG.0000000000000445.ArticlePubMedPMC
- 7. Baker H, Murdoch IE. Can a public health intervention improve awareness and health-seeking behaviour for glaucoma? Br J Ophthalmol 2008;92:1671-1675 https://doi.org/10.1136/bjo.2008.143537.ArticlePubMed
- 8. Gasch AT, Wang P, Pasquale LR. Determinants of glaucoma awareness in a general eye clinic. Ophthalmology 2000;107:303-308 https://doi.org/10.1016/s0161-6420(99)00076-7.ArticlePubMed
- 9. Gyawali R, Sarkar N. Glaucoma awareness in a hospital presenting population in eastern Nepal. J Glaucoma 2014;23:594-598 https://doi.org/10.1097/IJG.0b013e31828700de.ArticlePubMed
- 10. Peralta E, Muir KW, Rosdahl JA. Systematic review of knowledge assessments for glaucoma patients. Semin Ophthalmol 2018;33:377-388 https://doi.org/10.1080/08820538.2016.1247180.ArticlePubMed
- 11. Friedman DS, Okeke CO, Jampel HD, Ying GS, Plyler RJ, Jiang Y, et al. Risk factors for poor adherence to eyedrops in electronically monitored patients with glaucoma. Ophthalmology 2009;116:1097-1105 https://doi.org/10.1016/j.ophtha.2009.01.021.ArticlePubMed
- 12. Michielutte R, Diseker RA, Stafford CL, Carr P. Knowledge of diabetes and glaucoma in a rural North Carolina community. J Community Health 1984;9:269-284 https://doi.org/10.1007/BF01338727.ArticlePubMed
- 13. Muir KW, Santiago-Turla C, Stinnett SS, Herndon LW, Allingham RR, Challa P, et al. Health literacy and adherence to glaucoma therapy. Am J Ophthalmol 2006;142:223-226 https://doi.org/10.1016/j.ajo.2006.03.018.ArticlePubMed
- 14. Ichhpujani P, Bhartiya S, Kataria M, Topiwala P. Knowledge, attitudes and self-care practices associated with glaucoma among hospital personnel in a tertiary care center in North India. J Curr Glaucoma Pract 2012;6:108-112 https://doi.org/10.5005/jp-journals-10008-1116.ArticlePubMedPMC
- 15. Elliott AJ. Glaucoma: ignorance and apathy. Eye (Lond) 1989;3:485-486 https://doi.org/10.1038/eye.1989.74.ArticlePubMed
- 16. Hoevenaars JG, Schouten JS, van den Borne B, Beckers HJ, Webers CA. Knowledge base and preferred methods of obtaining knowledge of glaucoma patients. Eur J Ophthalmol 2005;15:32-40 https://doi.org/10.1177/112067210501500106.ArticlePubMed
- 17. Pfeiffer N, Krieglstein GK, Wellek S. Knowledge about glaucoma in the unselected population: a German survey. J Glaucoma 2002;11:458-463 https://doi.org/10.1097/00061198-200210000-00016.ArticlePubMed
- 18. Nkum G, Lartey S, Frimpong C, Micah F, Nkum B. Awareness and knowledge of glaucoma among adult patients at the eye clinic of a teaching hospital. Ghana Med J 2015;49:195-199 https://doi.org/10.4314/gmj.v49i3.11.ArticlePubMedPMC
- 19. Becerril-Ledezma V, Alvarez-Ascencio D, Del Hierro-Gutiérrez CE, Hernandez-Oteyza A, Jiménez-Román J. Knowledge and awareness of glaucoma in Mexican patients with and without glaucoma diagnosis in an Ophthalmology Referral Center. Int J Ophthalmol 2022;15:990-996 https://doi.org/10.18240/ijo.2022.06.18.ArticlePubMedPMC
- 20. Stormacq C, Van den Broucke S, Wosinski J. Does health literacy mediate the relationship between socioeconomic status and health disparities? Integrative review. Health Promot Int 2019;34:e1-e17 https://doi.org/10.1093/heapro/day062.ArticlePubMed
- 21. Buys YM, Jin YP; Canadian Glaucoma Risk Factor Study Group. Socioeconomic status as a risk factor for late presentation of glaucoma in Canada. Can J Ophthalmol 2013;48:83-87 https://doi.org/10.1016/j.jcjo.2012.10.003.ArticlePubMed
- 22. Oh SA, Ra H, Jee D. Socioeconomic status and glaucoma: associations in high levels of income and education. Curr Eye Res 2019;44:436-441 https://doi.org/10.1080/02713683.2018.1548129.ArticlePubMed
- 23. Wagstaff A, Paci P, van Doorslaer E. On the measurement of inequalities in health. Soc Sci Med 1991;33:545-557 https://doi.org/10.1016/0277-9536(91)90212-u.ArticlePubMed
- 24. Moore JC, Stinson LL, Welniak EJ. Income measurement error in surveys: a review. J Off Stat 2000;16:331-362.
- 25. Nobles J, Weintraub MR, Adler NE. Subjective socioeconomic status and health: relationships reconsidered. Soc Sci Med 2013;82:58-66 https://doi.org/10.1016/j.socscimed.2013.01.021.ArticlePubMedPMC
- 26. Tan JJ, Kraus MW, Carpenter NC, Adler NE. The association between objective and subjective socioeconomic status and subjective well-being: a meta-analytic review. Psychol Bull 2020;146:970-1020 https://doi.org/10.1037/bul0000258.ArticlePubMed
- 27. O’Donnell O, O’Neill S, Van Ourti T, Walsh B. Conindex: estimation of concentration indices. Stata J 2016;16:112-138 https://doi.org/10.1177/1536867X1601600112.ArticlePubMedPMC
- 28. Kakwani N, Wagstaff A, Van Doorslaer E. Socioeconomic inequalities in health: measurement, computation, and statistical inference. J Econom 1997;77:87-103.Article
- 29. Lee MC, Jones AM. Understanding differences in income-related health inequality between geographic regions in Taiwan using the SF-36. Health Policy 2007;83:186-195 https://doi.org/10.1016/j.healthpol.2007.01.007.ArticlePubMed
- 30. Bozdogan H. Model selection and Akaike’s information criterion (AIC): the general theory and its analytical extensions. Psychometrika 1987;52:345-370 https://doi.org/10.1007/BF02294361.Article
- 31. Falch T, Massih SS. The effect of education on cognitive ability. Econ Inq 2011;49:838-856 https://doi.org/10.1111/j.1465-7295.2010.00312.x.ArticlePubMed
- 32. Gasch AT, Wang P, Pasquale LR. Determinants of glaucoma awareness in a general eye clinic. Ophthalmology 2000;107:303-308 https://doi.org/10.1016/s0161-6420(99)00076-7.ArticlePubMed
- 33. Kosoko O, Quigley HA, Vitale S, Enger C, Kerrigan L, Tielsch JM. Risk factors for noncompliance with glaucoma follow-up visits in a residents’ eye clinic. Ophthalmology 1998;105:2105-2111 https://doi.org/10.1016/S0161-6420(98)91134-4.ArticlePubMed
 PubReader
 ePub Link
 Cite
Cite