Articles
- Page Path
- HOME > Epidemiol Health > Volume 32; 2010 > Article
-
Original Article
Green Tea Consumption and Stomach Cancer Risk: A Meta-Analysis - Hyunseok Kang1,2, Sun Young Rha3, Kyung Won Oh4, Chung Mo Nam5
-
Epidemiol Health 2010;32:e2010001.
DOI: https://doi.org/10.4178/epih/e2010001
Published online: April 26, 2010
1Department of Epidemiology and Biostatistics, Graduate School of Public Health, Yonsei University, Seoul, Korea.
2Department of Medicine, St.Luke's-Roosevelt Hospital Center, Columbia University College of Physicians and Surgeons, New York, NY, USA.
3Cancer Metastasis Research Center, Yonsei University College of Medicine, Seoul, Korea.
4Division of Chronic Disease Surveillance, Korea Centers for Disease Control and Prevention, Seoul, Korea.
5Department of Preventive Medicine, Yonsei University College of Medicine, Seoul, Korea.
- Correspondence: Chung Mo Nam, PhD. Department of Preventive Medicine, Yonsei University College of Medicine, 134 Shinchon-dong, Seodaemun-gu, Seoul 120-752, Korea. Tel: +82-2-2228-1871, Fax: +82-2-392-8133, cmnam@yuhs.ac
© 2010, Korean Society of Epidemiology
This is an open-access article distributed under the terms of the Creative Commons Attribution License (http://creativecommons.org/licenses/by/3.0/), which permits unrestricted use, distribution, and reproduction in any medium, provided the original work is properly cited.
- 18,272 Views
- 129 Download
- 29 Crossref
Abstract
-
OBJECTIVES
- Green tea has been suggested to have a chemopreventive effect against various cancers including stomach cancer. The aim of this study is to elucidate the relationship between green tea consumption and stomach cancer risk by meta-analysis.
-
METHODS
- Eighteen observational studies were identified using MEDLINE, THE COCHRANE LIBRARY, RISS, and a manual search. Summary relative risks/odds ratios (RR/ORs) for the highest versus non/lowest green tea consumption levels were calculated on the basis of fixed and random effect models. Subgroup analyses were used to examine heterogeneity across the studies.
-
RESULTS
- The combined results indicate a reduced risk of stomach cancer with intake of green tea (RR/OR=0.86, 95% CI=0.74-1.00). Subgroup analysis with six studies that reported differences between the highest and lowest consumption levels equal to or greater than five cups/day revealed a statistically significant protective effect (RR/OR=0.68, 95% CI=0.53-0.87).
-
CONCLUSION
- Green tea appears to play a protective role against the development of stomach cancer. The results also suggest that a higher level of green tea consumption might be needed for a clear preventive effect to appear. This conclusion, however, should be interpreted with caution because various biases can affect the results of a meta-analysis.
- Risk factors for stomach cancer include infection with Helicobacter pylori, genetic factors, dietary intake, and cigarette smoking [1, 2]. Dietary intake has been suggested as an especially important factor in the etiology of stomach cancer when explaining geographic, socioeconomic, and chronologic discrepancies in the incidence [3].
- Presently, tea is the most widely consumed beverage in the world aside from water [4]. Tea is generally consumed in the form of green (20%), oolong (2%), or black (78%) tea, all of which originate from the leaves of the plant Camellia sinensis [5]. Among the teas, green tea contains many polyphenols known as catechins, such as epigallocatechin-3 gallate (EGCG), epigallocatechin (EGC) and epicatechin-3 gallate (ECG). Tea and the constituents of tea have been shown to inhibit tumorigenesis in many animal models, including those for cancer of the skin, lung, oral cavity, esophagus, stomach, small intestine, colon, liver, pancreas, bladder, breast and prostate [6]. Mechanisms that have been proposed for the biological activities of tea polyphenols include antioxidant activities, induction or inhibition of drug metabolizing enzymes, inhibition of arachidonic acid metabolism, inhibition of cell proliferation, induction of apoptosis, and inhibition of DNA methyltransferase, dihydrofolate reductase (DHFR), protease, and telomerase [7].
- Ahn et al. [8] reported significant favorable responses in women with human papilloma virus-infected cervical lesions treated with oral and/or topical green tea extract preparations, and Bettuzzi et al. [9] also reported that 600 mg of daily catechin extract derived from green tea had a statistically significant protective effect in patients with high-grade prostate intraepithelial neoplasia. Over the last three decades, a number of epidemiologic studies were conducted to investigate the association between green tea consumption and stomach cancer risk in human subjects. Recent narrative reviews have concluded that epidemiologic studies did not provide consistent evidence to support tea as a chemopreventive agent against stomach cancer development [10, 11]. There has never been any quantitative attempt, however, to summarize the results of studies exploring a possible green tea-stomach cancer association. The aim of this study is to elucidate the association between green tea consumption and stomach cancer risk by meta-analysis of previously published data.
INTRODUCTION
- Literature search and inclusion criteria
- To search for observational studies of green tea consumption in relation to stomach cancer risk, we conducted a literature search using the following medical databases, MEDLINE, THE COCHRANE LIBRARY, and RISS (to search for Korean literature); we restricted the search to papers published in English, Japanese or Korean, which were published up to May 2007. For the search, we identified articles using such medical subject-heading terms as "stomach neoplasms", "tea" or "catechin" or the keywords: "stomach cancer", "gastric cancer", "green tea", or "catechin". In addition, we also conducted a manual search of reference lists from the retrieved papers for further relevant publications.
- For inclusion in the meta-analysis, the identified articles had to meet the following criteria: 1) they had to be human studies, not laboratory or animal studies; 2) they had to document the daily consumption of the natural green tea product, not of green tea extracts or supplements; 3) the outcome of interest had to be an incidence of stomach cancer; 4) fulltext articles from the study had to be accessible to the authors. We excluded studies which did not provide information on (i) the number of stomach cancer cases and controls studied and/or (ii) the odds ratio (OR) or relative risk (RR) and its corresponding 95% confidence interval (CI) for highest versus non/lowest level of tea intake. When more than one studies analyzed the same dataset, only the most recent study was included in the analysis. These articles were reviewed independently by two authors (H.K. and C.M.N.) to determine whether the articles met the inclusion criteria of the present study.
- Statistical analysis
- Study-specific ORs/RRs and the corresponding 95% CIs for highest versus non/lowest green tea consumption levels were extracted from the publications. Crude OR was calculated from the numbers of cases and controls in one study [12] because the analysis included a previously published data [13]. If a study provided separate OR or RR estimates for men and women, we treated them as two different studies. For a study that provided two OR or RR estimates based on hospital and population controls, we used the estimate derived from the population control. The standard errors of the natural logarithms of the ORs or RRs were calculated from the 95% CIs of the ORs/RRs and used for the meta-analysis. Statistical computing was performed using the STATA statistical software (version 8.0; College Station, TX, USA).
- Possible heterogeneity of effect sizes across the studies was examined using the Q statistic [14]. Statistical significance for the heterogeneity test was defined as p<0.10 rather than the conventional level of 0.05 because of the low power of this test [15]. When there was significant heterogeneity among effect sizes, the random effect model was used to calculate the summary RR/OR. When the results of the studies were homogenous, the fixed effect model was used instead. The causes of heterogeneity were further explored through subgroup analyses.
- For calculation of the difference between the highest and lowest consumption levels of green tea, all the measured consumption levels were converted to a cups-per-day scale. Each gram of green tea consumed shown in two of the Chinese studies was converted to 0.25 cup following the suggestion by Mu et al. [11]. For the study by Nagano et al. [16], we assumed one cup of green tea would be consumed at a time. Yu et al. [17] reported the number of new batches of green tea used. Among those who used more than four batches a day, 12% brewed 1-3 cups per batch and 88% brewed more than four cups per batch. The number of cups per day consumed was calculated using the following equation: (0.12×2+0.88×4)×4=15.
- To detect a possible publication bias, Begg's funnel plot was visually evaluated for any asymmetry. To formally test for a publication bias, Egger's un-weighted regression asymmetry test was done [18]. The funnel plot was considered to be asymmetrical if the intercept of Egger's regression line deviated from zero with a p value of less than 0.05.
MATERIALS AND METHODS
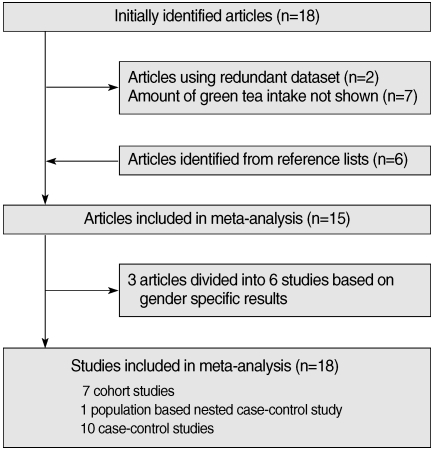
- Eighteen articles [11-13, 17, 19-32] were identified in the initial search with the above mentioned method. Six articles [16, 33-37] were identified from reference lists. Two studies [24, 34] using a redundant dataset were excluded. Seven other articles [12, 20, 26, 29-32] were excluded since they lacked information on the amount of green tea intake. As a result, fifteen articles were found to meet the inclusion criteria described above [11-13, 16, 17, 19, 22, 23, 27, 28, 33-37]. As three articles having gender-specific results were divided into six independent studies [22, 28, 33], a total of 18 studies were included in the study in the end. The selection process is shown in Figure 1. There were seven cohort studies, one population-based nested case-control study, and ten case-control studies. Twelve studies were conducted among the Japanese population in Japan, five studies were conducted among the Chinese population in China, and the other was conducted among the Japanese-born population in Hawaii, USA. All of the Chinese studies were case-control studies. Table 1 presents the characteristics of the studies used in the analysis.
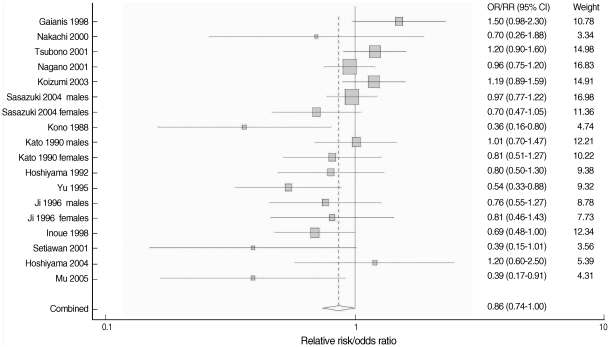
- The overall result, which is presented in Figure 2, showed a statistically significant, 14% reduction in the risk of stomach cancer with high green tea consumption (summary RR/OR=0.86, 95% CI=0.74-1.00). Table 2 presents the results of the subgroup analyses. When stratified by country (Japan versus China), results were homogenous among five Chinese studies (p=0.43) with a significant risk reduction of 39% (summary RR/OR=0.61, 95% CI=0.47-0.81). Results from the twelve Japanese studies were marginally homogenous (p=0.10) with a non-significant risk reduction of 8% (summary RR/OR=0.92, 95% CI=0.80-1.05). A statistically significant inverse association between green tea intake and stomach cancer was observed only in the eleven case-control studies (summary RR/OR=0.74, 95% CI=0.63-0.86). Results from the seven cohort studies failed to support the association (summary RR/OR=1.03, 95% CI=0.92-1.16).
- When stratified by gender, the results among men were divergent (p=0.02) while the results among women were consistent (p=0.53). Neither the studies of men nor of women showed any significant reduction in the risk (summary RR/OR=1.00 and 0.89, 95% CI=0.82-1.24 and 0.74-1.07, respectively). When stratified by difference between the highest and lowest green tea consumption levels, results among six studies with the difference equal to or greater than five cups/day were homogeneous (p=0.30) with a statistically significant risk reduction of 32% (summary RR/OR=0.68, 95% CI=0.54-0.85). Twelve studies with a difference of less than five cups/day showed heterogeneous results (p=0.04) with a non-significant risk reduction of 6% (summary RR/OR=0.94, 95% CI=0.81-1.10).
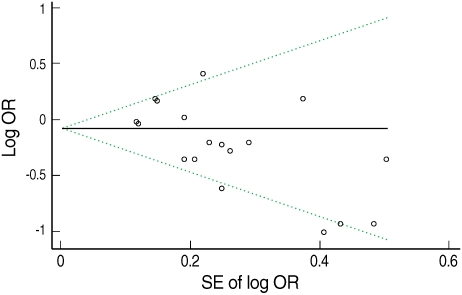
- Figure 3 presents Begg's funnel plot. Visual exploration of the plot revealed an apparent asymmetry-smaller studies tended to report a protective effect of green tea while larger studies showed more mixed results. The result of Egger's test also supported the suspicion of publication bias (intercept=-2.02, p=0.01).
RESULTS
- This meta-analysis investigated the association between green tea consumption and stomach cancer risk on the basis of previously published researches. The overall summary RR/OR for green tea consumption and stomach cancer risk, as derived from eighteen observational studies, indicated a statistically significant 14% risk reduction in the high green tea consumption group.
- The reduced risk of stomach cancer in green tea drinkers was observed in studies with differences between the highest and lowest daily green tea consumption levels equal to or greater than five cups per day. Also, the studies conducted in China showed a stronger reduction in stomach cancer among green tea drinkers than those conducted in Japan. A few authors have argued that the relative lack of subjects in Japan who do not drink green tea may have resulted in an insufficient number of non-drinkers, and this might be an explanation for the weaker associations among Japanese studies [11, 16, 38]. When a meta-analysis was done with the four Japanese studies in which the difference between the highest and lowest consumption levels was greater than five cups/day [19, 27, 34, 37], the summary RR/OR and 95% CI were 0.72 and 0.53-0.97. This implies that if a large prospective study with a more detailed categorization of green tea consumption were performed, a protective effect of large amount of green tea intake might be shown. This also implies that the lack of protective effect of green tea shown in studies which compared relatively lower level of green tea consumption might be because of not enough intake of green tea itself. Another possible explanation is the difference in the production processes among Japan and the other countries. In Japan, green tea production involves a steaming process at a high temperature to retain the green color of the tea. This process may lead to changes in chemical composition and in the concentrations of bioactive constituents such as vitamins C and E, which may also contribute to the chemopreventive properties of green tea [11]. Also, the bioactivity of a cup of green tea differs by the amount of green tea leaves used to brew it and the frequency of renewing a tea batch in the pot [16]. Differences in tea preparation and drinking habits may, therefore, be a partial explanation for the differing results.
- Research design also seemed to play an important role in the heterogeneity of effect sizes across the studies. While the protective effect was observed among case-control studies only, prospective studies tended to show null results. A few prospective studies even showed increased risks with green tea consumption although they were not statistically significant [12, 13, 35]. Some authors suggested that tea might have a mutagenic effect [35], but this hypothesis is contradictory to the results of most laboratory research. The number of cases was very small for the green tea drinkers in the report by Galanis et al. [35], and that may have resulted in the exaggerated risk estimates.
- Sasazuki et al. [28] suggested that there might be a gender-specific protective effect of green tea on stomach cancer, but the analysis of seven studies that included gender information revealed a statistically non-significant effect on both genders (estimates of RR/OR=1.00 for men and 0.89 for women, 95% CI=0.82-1.24 for men, 0.74-1.07 for women). Thus, gender does not seem to cause any difference in the effect of green tea on stomach cancer risk.
- Site-specific stomach cancer incidence in accordance with green tea consumption was mentioned in four studies [12, 17, 22, 28]. While Ji et al. [22] and Koizumi et al. [12] showed no difference between green tea consumption and stomach cancer risk by anatomical subsite (data not shown), the other two authors reported a different risk pattern by subsite. Yu et al. [17] showed a significant protective effect for pyloric tumors (OR= 0.29, 95% CI=0.13-0.68), and Sasazuki et al. [28] reported a significant effect for distal tumors among women (OR=0.53, 95% CI=0.30-0.86). Although more studies are needed to address this issue, it is possible that green tea consumption might be related to distal stomach cancers only. It is recommended that future studies take this into consideration.
- Total duration of green tea drinking was considered in three of the Chinese studies [11, 17, 23]. All of them showed a decreased risk of stomach cancer with increasing duration of green tea drinking, but this result failed to reach statistical significance (data not shown). Further studies are needed to clarify this point. It is known that Helicobacter pylori infection is an important risk factor for a stomach cancer [1]. Only two studies [11, 23], however, controlled for the bacteria infection in their analyses. Green tea has been considered to have bacteriostatic and bactericidal effects [39, 40], which can extend to Helicobacter pylori. Thus, the infection could have confounded the results, and further study is needed.
- This meta-analysis has several limitations. First of all, publication bias cannot be ruled out. As shown in the subgroup analysis, the protective effect of green tea was prominent among case-control studies, which could be easily misled by a publication bias. Because of the asymmetric funnel plot, publication bias cannot be ruled out in this study. Second, the research included in this study had different categories for green tea consumption. Although the odds ratio or relative risk of the highest consumption versus non/lowest consumption was used for combining the effect size, it was not uniform across the studies. This might have distorted the result. Third, the (non-English) Chinese literature could not be reviewed because of the language barrier. Because results from the Chinese studies tended to show protective effects, the combined effect would have been different if they had been included in the study. Last, all of the studies included in the analysis had been done among Asian populations. Green tea is a popular drink in East Asia, while black tea is mostly consumed in Western countries. The result of this study cannot be applied to non-Asian populations.
- In summary, the result of this meta-analysis suggests a protective role of green tea against stomach cancer. Subgroup analyses revealed that the difference between the measured highest and lowest green tea consumption level was found to be the most prominent factor affecting the heterogeneity of the meta-analysis. This implies that the daily consumption level might be an important factor in determining the preventive effect of green tea against stomach cancer. Further research focusing on higher green tea consumption level is needed to clarify the association.
DISCUSSION
-
The authors have no conflict of interest to declare on this study.
-
This article is available from: http://e-epih.org/
NOTES
- 1. Helicobacter and Cancer Collaborative Group. Gastric cancer and Helicobacter pylori: a combined analysis of 12 case control studies nested within prospective cohorts. Gut 2001;49:347-353. 11511555.ArticlePubMedPMC
- 2. Forman D, Burley VJ. Gastric cancer: global pattern of the disease and an overview of environmental risk factors. Best Pract Res Clin Gastroenterol 2006;20:633-649. 16997150.ArticlePubMed
- 3. Kelley JR, Duggan JM. Gastric cancer epidemiology and risk factors. J Clin Epidemiol 2003;56:1-9. 12589864.ArticlePubMed
- 4. Kuriyama S, Shimazu T, Ohmori K, Kikuchi N, Nakaya N, Nishino Y, et al. Green tea consumption and mortality due to cardiovascular disease, cancer, and all causes in Japan: the Ohsaki study. JAMA 2006;296:1255-1265. 16968850.ArticlePubMed
- 5. Jankun J, Selman SH, Swiercz R, Skrzypczak-Jankun E. Why drinking green tea could prevent cancer. Nature 1997;387:561. 9177339.ArticlePubMed
- 6. Yang CS, Maliakal P, Meng X. Inhibition of carcinogenesis by tea. Annu Rev Pharmacol Toxicol 2002;42:25-54. 11807163.ArticlePubMed
- 7. Yang CS, Sang S, Lambert JD, Hou Z, Ju J, Lu G. Possible mechanisms of the cancer-preventive activities of green tea. Mol Nutr Food Res 2006;50:170-175. 16425280.ArticlePubMed
- 8. Ahn WS, Yoo J, Huh SW, Kim CK, Lee JM, Namkoong SE, et al. Protective effects of green tea extracts (polyphenon E and EGCG) on human cervical lesions. Eur J Cancer Prev 2003;12:383-390. 14512803.ArticlePubMed
- 9. Bettuzzi S, Brausi M, Rizzi F, Castagnetti G, Peracchia G, Corti A. Chemoprevention of human prostate cancer by oral administration of green tea catechins in volunteers with high-grade prostate intraepithelial neoplasia: a preliminary report from a one-year proof-of-principle study. Cancer Res 2006;66:1234-1240. 16424063.ArticlePubMed
- 10. Hoshiyama Y, Kawaguchi T, Miura Y, Mizoue T, Tokui N, Yatsuya H, et al. Green tea and stomach cancer-a short review of prospective studies. J Epidemiol 2005;15:S109-S112. 16127221.ArticlePubMedPMC
- 11. Mu LN, Lu QY, Yu SZ, Jiang QW, Cao W, You NC, et al. Green tea drinking and multigenetic index on the risk of stomach cancer in a Chinese population. Int J Cancer 2005;116:972-983. 15856451.ArticlePubMedPMC
- 12. Koizumi Y, Tsubono Y, Nakaya N, Nishino Y, Shibuya D, Matsuoka H, et al. No association between green tea and the risk of gastric cancer: pooled analysis of two prospective studies in Japan. Cancer Epidemiol Biomarkers Prev 2003;12:472-473. 12750246.PubMed
- 13. Tsubono Y, Nishino Y, Komatsu S, Hsieh CC, Kanemura S, Tsuji I, et al. Green tea and the risk of gastric cancer in Japan. N Engl J Med 2001;344:632-636. 11228277.ArticlePubMed
- 14. DerSimonian R, Laird N. Meta-analysis in clinical trials. Control Clin Trials 1986;7:177-188. 3802833.ArticlePubMed
- 15. Hedges LV, Pigott TD. The power of statistical tests in meta-analysis. Psychol Methods 2001;6:203-217. 11570228.ArticlePubMed
- 16. Nagano J, Kono S, Preston DL, Mabuchi K. A prospective study of green tea consumption and cancer incidence, Hiroshima and Nagasaki (Japan). Cancer Causes Control 2001;12:501-508. 11519758.ArticlePubMed
- 17. Yu GP, Hsieh CC, Wang LY, Yu SZ, Li XL, Jin TH. Green-tea consumption and risk of stomach cancer: a population-based case-control study in Shanghai, China. Cancer Causes Control 1995;6:532-538. 8580302.ArticlePubMed
- 18. Egger M, Davey Smith G, Schneider M, Minder C. Bias in meta-analysis detected by a simple, graphical test. Brit Med J 1997;315:629-634. 9310563.ArticlePubMedPMC
- 19. Kono S, Ikeda M, Tokudome S, Kuratsune M. A case-control study of gastric cancer and diet in northern Kyushu, Japan. Jpn J Cancer Res 1988;79:1067-1074. 3143695.ArticlePubMedPMC
- 20. Demirer T, Icli F, Uzunalimoglu O, Kucuk O. Diet and stomach cancer incidence. A case-control study in Turkey. Cancer 1990;65:2344-2348. 2346918.ArticlePubMed
- 21. Lee HH, Wu HY, Chuang YC, Chang AS, Chao HH, Chen KY, et al. Epidemiologic characteristics and multiple risk factors of stomach cancer in Taiwan. Anticancer Res 1990;10:875-881. 2382983.PubMed
- 22. Ji BT, Chow WH, Yang G, McLaughlin JK, Gao RN, Zheng W, et al. The influence of cigarette smoking, alcohol, and green tea consumption on the risk of carcinoma of the cardia and distal stomach in Shanghai, China. Cancer 1996;77:2449-2457. 8640692.ArticlePubMed
- 23. Setiawan VW, Zhang ZF, Yu GP, Lu QY, Li YL, Lu ML, et al. Protective effect of green tea on the risks of chronic gastritis and stomach cancer. Int J Cancer 2001;92:600-604. 11304697.ArticlePubMed
- 24. Fujino Y, Tamakoshi A, Ohno Y, Mizoue T, Tokui N, Yoshimura T, et al. Prospective study of educational background and stomach cancer in Japan. Prev Med 2002;35:121-127. 12200096.ArticlePubMed
- 25. Hoshiyama Y, Kawaguchi T, Miura Y, Mizoue T, Tokui N, Yatsuya H, et al. A prospective study of stomach cancer death in relation to green tea consumption in Japan. Br J Cancer 2002;87:309-313. 12177800.ArticlePubMedPMC
- 26. Sun CL, Yuan JM, Lee MJ, Yang CS, Gao YT, Ross RK, et al. Urinary tea polyphenols in relation to gastric and esophageal cancers: a prospective study of men in Shanghai, China. Carcinogenesis 2002;23:1497-1503. 12189193.ArticlePubMed
- 27. Hoshiyama Y, Kawaguchi T, Miura Y, Mizoue T, Tokui N, Yatsuya H, et al. A nested case-control study of stomach cancer in relation to green tea consumption in Japan. Br J Cancer 2004;90:135-138. 14710220.ArticlePubMedPMC
- 28. Sasazuki S, Inoue M, Hanaoka T, Yamamoto S, Sobue T, Tsugane S. Green tea consumption and subsequent risk of gastric cancer by subsite: the JPHC Study. Cancer Causes Control 2004;15:483-491. 15286468.ArticlePubMed
- 29. Youm PY, Kim SH. A case-control study on dietary and other factors related to stomach cancer incidence. Korean J Nutr 1998;31:62-71 (Korean).
- 30. Kim YJ, Kim CH, Shim SJ. Meta analysis for the relation between Korean dietary factors and stomach cancer. J Korean Acad Fam Med 2002;23:1098-1106 (Korean).
- 31. Suh SW, Koo BK, Choi YH, Lee HS. Life-style and eating behaviors of the stomach cancer patients in Daegu and Kyungpook area in Korea. Korean J Nutr 2002;35:380-393 (Korean).
- 32. Yoon EY. Dietary risk factors of gastric cancer & nutrition intervention. Korean J Community Nutr 2004;9:353-365 (Korean).
- 33. Kato I, Tominaga S, Ito Y, Kobayashi S, Yoshii Y, Matsuura A, et al. A comparative case-control analysis of stomach cancer and atrophic gastritis. Cancer Res 1990;50:6559-6564. 2208116.PubMed
- 34. Hoshiyama Y, Sasaba T. A case-control study of single and multiple stomach cancers in Saitama Prefecture, Japan. Jpn J Cancer Res 1992;83:937-943. 1429203.ArticlePubMedPMC
- 35. Galanis DJ, Kolonel LN, Lee J, Nomura A. Intakes of selected foods and beverages and the incidence of gastric cancer among the Japanese residents of Hawaii: a prospective study. Int J Epidemiol 1998;27:173-180. 9602395.ArticlePubMed
- 36. Inoue M, Tajima K, Hirose K, Hamajima N, Takezaki T, Kuroishi T, et al. Tea and coffee consumption and the risk of digestive tract cancers: data from a comparative case-referent study in Japan. Cancer Causes Control 1998;9:209-216. 9578298.ArticlePubMed
- 37. Nakachi K, Matsuyama S, Miyake S, Suganuma M, Imai K. Preventive effects of drinking green tea on cancer and cardiovascular disease: epidemiological evidence for multiple targeting prevention. Biofactors 2000;13:49-54. 11237198.ArticlePubMed
- 38. Sun CL, Yuan JM, Koh WP, Yu MC. Green tea, black tea and colorectal cancer risk: a meta-analysis of epidemiologic studies. Carcinogenesis 2006;27:1301-1309. 16638787.ArticlePubMed
- 39. Horiba N, Maekawa Y, Ito M, Matsumoto T, Nakamura H. A pilot study of Japanese green tea as a medicament: antibacterial and bactericidal effects. J Endod 1991;17:122-124. 1940726.ArticlePubMed
- 40. Yam TS, Shah S, Hamilton-Miller JM. Microbiological activity of whole and fractionated crude extracts of tea (Camellia sinensis), and of tea components. FEMS Microbiol Lett 1997;152:169-174. 9228784.ArticlePubMed
REFERENCES


Case-control studies are population-based unless otherwise specified.
*In two cohorts reported in the article, crude RR and 95%CI were calculated from the numbers from the previously unpublished cohort 2; †RR/ORs were the results of a pooled analysis of two cohorts reported in the study; ‡Crude RR/OR and 95%CI were calculated from the numbers shown in the study; §Crude RR/ORs and 95%CIs were calculated from the numbers given in the study for men and women respectively.
Figure & Data
References
Citations
- Association between green tea intake and digestive system cancer risk in European and East Asian populations: a Mendelian randomization study
Duorui Nie, Xiaoyu He, Hao Zheng, Deyu Deng, Fanghui He, Ruyi Li, Xiaoting Ni, Shunxiang Li, Fei Xu
European Journal of Nutrition.2024;[Epub] CrossRef - Sex differences in the benefit of tea consumption: A critical summation of the epidemiological evidence
Changhuai He, Pin Ye, Xuecheng Zhang, Yiqing Li, Qingping Li, Ping Lü, Chuanqi Cai, Xun Cai
Food Bioscience.2024; 58: 103716. CrossRef - In situ global proteomics profiling of EGCG targets using a cell-permeable and Click-able bioorthogonal probe
Revathy Sahadevan, Anupama Binoy, Sai K. Vechalapu, Pandurangan Nanjan, Sushabhan Sadhukhan
International Journal of Biological Macromolecules.2023; 237: 123991. CrossRef - Pancreatic cancer risk: alcoholic and non-alcoholic beverages
Irina N. Grigor’eva
Terapevticheskii arkhiv.2022; 94(2): 265. CrossRef - Diet and gastric cancer risk: an umbrella review of systematic reviews and meta-analyses of prospective cohort studies
Shu-Jun Liu, Pi-Di Huang, Jia-Min Xu, Qian Li, Jian-Hui Xie, Wen-Zhen Wu, Chen-Tong Wang, Xiao-Bo Yang
Journal of Cancer Research and Clinical Oncology.2022; 148(8): 1855. CrossRef - Anticarcinogenic potentials of tea catechins
Xiao-Xiang Li, Chang Liu, Shu-Ling Dong, Can-Song Ou, Jian-Liang Lu, Jian-Hui Ye, Yue-Rong Liang, Xin-Qiang Zheng
Frontiers in Nutrition.2022;[Epub] CrossRef - Green tea and cancer and cardiometabolic diseases: a review of the current epidemiological evidence
Sarah Krull Abe, Manami Inoue
European Journal of Clinical Nutrition.2021; 75(6): 865. CrossRef - Antimetastatic Properties of Tea Polyphenols
Niladri Bag, Arundhati Bag
Nutrition and Cancer.2020; 72(3): 365. CrossRef - Nanoencapsulated dietary polyphenols for cancer prevention and treatment: successes and challenges
Shams Tabrez, Nasimudeen R Jabir, Vaqar Mustafa Adhami, Mohammad Imran Khan, Mohammed Moulay, Mohammad Amjad Kamal, Hasan Mukhtar
Nanomedicine.2020; 15(11): 1147. CrossRef - In Search of Panacea—Review of Recent Studies Concerning Nature-Derived Anticancer Agents
Dawid Przystupski, Magdalena J. Niemczura, Agata Górska, Stanisław Supplitt, Krzysztof Kotowski, Piotr Wawryka, Paulina Rozborska, Kinga Woźniak, Olga Michel, Aleksander Kiełbik, Weronika Bartosik, Jolanta Saczko, Julita Kulbacka
Nutrients.2019; 11(6): 1426. CrossRef - The Cytoprotective Role of Antioxidants in Mammalian Cells Under Rapidly Varying UV Conditions During Stratospheric Balloon Campaign
Dawid Przystupski, Agata Górska, Paulina Rozborska, Weronika Bartosik, Olga Michel, Joanna Rossowska, Anna Szewczyk, Małgorzata Drąg-Zalesińska, Paulina Kasperkiewicz, Jędrzej Górski, Julita Kulbacka
Frontiers in Pharmacology.2019;[Epub] CrossRef - Mechanisms of Phytonutrient Modulation of Cyclooxygenase-2 (COX-2) and Inflammation Related to Cancer
Shreena J. Desai, Ben Prickril, Avraham Rasooly
Nutrition and Cancer.2018; 70(3): 350. CrossRef - Green Tea Consumption and the Risk of Liver Cancer: A Meta-Analysis
Chen-Xu Ni, Hong Gong, Ying Liu, Yang Qi, Chun-Lei Jiang, Jun-Ping Zhang
Nutrition and Cancer.2017; 69(2): 211. CrossRef - An inverse association between tea consumption and colorectal cancer risk
Yuetong Chen, Yuan Wu, Mulong Du, Haiyan Chu, Lingjun Zhu, Na Tong, Zhengdong Zhang, Meilin Wang, Dongying Gu, Jinfei Chen
Oncotarget.2017; 8(23): 37367. CrossRef - Epigallocatechin Gallate Nanodelivery Systems for Cancer Therapy
Andreia Granja, Marina Pinheiro, Salette Reis
Nutrients.2016; 8(5): 307. CrossRef - Total, caffeinated and decaffeinated coffee and tea intake and gastric cancer risk: Results from the EPIC cohort study
Harinakshi Sanikini, Vincent K. Dik, Peter D. Siersema, Nirmala Bhoo‐Pathy, Cuno S.P.M. Uiterwaal, Petra H.M. Peeters, Carlos A. González, Raul Zamora‐Ros, Kim Overvad, Anne Tjønneland, Nina Roswall, Marie‐Christine Boutron‐Ruault, Guy Fagherazzi, Antoine
International Journal of Cancer.2015;[Epub] CrossRef - Methylenetetrahydrofolate reductase (MTHFR) polymorphism susceptibility to schizophrenia and bipolar disorder: an updated meta-analysis
Cai-Yun Hu, Zhen-Zhong Qian, Feng-Feng Gong, Shan-Shan Lu, Fang Feng, Yi-Le Wu, Hui-Yun Yang, Ye-Huan Sun
Journal of Neural Transmission.2014;[Epub] CrossRef - Association of Risk of Gastric Cancer and Consumption of Tobacco, Alcohol and Tea in the Chinese Population
Gui-Xian Tong, Han Liang, Jing Chai, Jing Cheng, Rui Feng, Peng-Lai Chen, Qing-Qing Geng, Xing-Rong Shen, De-Bin Wang
Asian Pacific Journal of Cancer Prevention.2014; 15(20): 8765. CrossRef - Green Tea Consumption and Risk of Pancreatic Cancer: A Meta-analysis
Jin-Long Zeng, Zhi-Hua Li, Zhi-Chao Wang, Hai-Liang Zhang
Nutrients.2014; 6(11): 4640. CrossRef - Tea consumption and the risk of five major cancers: a dose–response meta-analysis of prospective studies
Feifei Yu, Zhichao Jin, Hong Jiang, Chun Xiang, Jianyuan Tang, Tuo Li, Jia He
BMC Cancer.2014;[Epub] CrossRef - Evidence-based assessment of proton-pump inhibitors inHelicobacter pylorieradication: A systematic review
Vinayak Nagaraja
World Journal of Gastroenterology.2014; 20(40): 14527. CrossRef - Coffee and beverages are the major contributors to polyphenol consumption from food and beverages in Japanese middle-aged women
Yoichi Fukushima, Takeshi Tashiro, Akiko Kumagai, Hiroyuki Ohyanagi, Takumi Horiuchi, Kazuhiro Takizawa, Norie Sugihara, Yoshimi Kishimoto, Chie Taguchi, Mariko Tani, Kazuo Kondo
Journal of Nutritional Science.2014;[Epub] CrossRef - Tea consumption and prostate cancer: an updated meta-analysis
Yi-wei Lin, Zheng-hui Hu, Xiao Wang, Qi-qi Mao, Jie Qin, Xiang-yi Zheng, Li-ping Xie
World Journal of Surgical Oncology.2014;[Epub] CrossRef - Health-promoting effects of green tea
Yasuo SUZUKI, Noriyuki MIYOSHI, Mamoru ISEMURA
Proceedings of the Japan Academy, Series B.2012; 88(3): 88. CrossRef - Flavonoids and Cancer Prevention: A Review of the Evidence
Donato F. Romagnolo, Ornella I. Selmin
Journal of Nutrition in Gerontology and Geriatrics.2012; 31(3): 206. CrossRef - Overview of Methodological Quality of Systematic Reviews about Gastric Cancer Risk and Protective Factors
Lun Li, Xiang-Ji Ying, Tian-Tian Sun, Kang Yi, Hong-Liang Tian, Rao Sun, Jin-Hui Tian, Ke-Hu Yang
Asian Pacific Journal of Cancer Prevention.2012; 13(5): 2069. CrossRef - Growth inhibition of Walker carcinosarcoma 256 with alcoholic extract of green tea leaves (Camellia sinensis)
Mauriclécio Franco Ponte, Thiago Sousa e Silva Targino, Matheus Alves de Lima Mota, José Saul Peixoto Landim, Thyciana Rodrigues Ribeiro, Fabiana Pereira Soares, Márcio Roberto Pinho Pereira, Sônia Leite da Silva, Silvia Fernandes Ribeiro da Silva
Acta Cirurgica Brasileira.2012; 27(9): 634. CrossRef - Prospective cohort study of tea consumption and risk of digestive system cancers: results from the Shanghai Women's Health Study
Sarah Nechuta, Xiao-Ou Shu, Hong-Lan Li, Gong Yang, Bu-Tian Ji, Yong-Bing Xiang, Hui Cai, Wong-Ho Chow, Yu-Tang Gao, Wei Zheng
The American Journal of Clinical Nutrition.2012; 96(5): 1056. CrossRef - What Should be Taken into Consideration for a Meta-Analysis of Green Tea Consumption and Stomach Cancer Risk?
Jeongseon Kim
Epidemiology and Health.2010; 32: e2010012. CrossRef
 PubReader
 ePub Link
 Cite
Cite